Filters: Tags: geospatial analysis (X)
808 results (41ms)|
Filters
Date Range
Extensions Types Contacts
Categories
Tag Types
|
Understanding how sea-level rise will affect coastal landforms and the species and habitats they support is critical for crafting approaches that balance the needs of humans and native species. Given this increasing need to forecast sea-level rise effects on barrier islands in the near and long terms, we are developing Bayesian networks to evaluate and to forecast the cascading effects of sea-level rise on shoreline change, barrier island state, and piping plover habitat availability. We use publicly available data products, such as lidar, orthophotography, and geomorphic feature sets derived from those, to extract metrics of barrier island characteristics at consistent sampling distances. The metrics are then incorporated...
Categories: Data;
Types: Downloadable,
GeoTIFF,
Map Service,
OGC WFS Layer,
OGC WMS Layer,
Raster,
Shapefile;
Tags: Atlantic Ocean,
Barrier Island,
Bayesian Network,
CMHRP,
Cape Hatteras,
Understanding how sea-level rise will affect coastal landforms and the species and habitats they support is critical for crafting approaches that balance the needs of humans and native species. Given this increasing need to forecast sea-level rise effects on barrier islands in the near and long terms, we are developing Bayesian networks to evaluate and to forecast the cascading effects of sea-level rise on shoreline change, barrier island state, and piping plover habitat availability. We use publicly available data products, such as lidar, orthophotography, and geomorphic feature sets derived from those, to extract metrics of barrier island characteristics at consistent sampling distances. The metrics are then incorporated...
Categories: Data;
Types: Downloadable,
GeoTIFF,
Map Service,
Raster;
Tags: Atlantic Ocean,
Barrier Island,
Bayesian Network,
CMGP,
Charadrius melodus,
Understanding how sea-level rise will affect coastal landforms and the species and habitats they support is critical for crafting approaches that balance the needs of humans and native species. Given this increasing need to forecast sea-level rise effects on barrier islands in the near and long terms, we are developing Bayesian networks to evaluate and to forecast the cascading effects of sea-level rise on shoreline change, barrier island state, and piping plover habitat availability. We use publicly available data products, such as lidar, orthophotography, and geomorphic feature sets derived from those, to extract metrics of barrier island characteristics at consistent sampling distances. The metrics are then incorporated...
Categories: Data;
Types: Downloadable,
GeoTIFF,
Map Service,
OGC WFS Layer,
OGC WMS Layer,
Raster,
Shapefile;
Tags: Atlantic Ocean,
Barrier Island,
Bayesian Network,
CMHRP,
Coastal Erosion,
Understanding how sea-level rise will affect coastal landforms and the species and habitats they support is critical for crafting approaches that balance the needs of humans and native species. Given this increasing need to forecast sea-level rise effects on barrier islands in the near and long terms, we are developing Bayesian networks to evaluate and to forecast the cascading effects of sea-level rise on shoreline change, barrier island state, and piping plover habitat availability. We use publicly available data products, such as lidar, orthophotography, and geomorphic feature sets derived from those, to extract metrics of barrier island characteristics at consistent sampling distances. The metrics are then incorporated...
Categories: Data;
Types: Downloadable,
GeoTIFF,
Map Service,
Raster;
Tags: Atlantic Ocean,
Barrier Island,
Bayesian Network,
CMGP,
Charadrius melodus,
Understanding how sea-level rise will affect coastal landforms and the species and habitats they support is critical for crafting approaches that balance the needs of humans and native species. Given this increasing need to forecast sea-level rise effects on barrier islands in the near and long terms, we are developing Bayesian networks to evaluate and to forecast the cascading effects of sea-level rise on shoreline change, barrier island state, and piping plover habitat availability. We use publicly available data products, such as lidar, orthophotography, and geomorphic feature sets derived from those, to extract metrics of barrier island characteristics at consistent sampling distances. The metrics are then incorporated...
Categories: Data;
Types: Downloadable,
GeoTIFF,
Map Service,
Raster;
Tags: Atlantic Ocean,
CMHRP,
Coastal Habitat,
Coastal and Marine Hazards and Resources Program,
Delmarva Peninsula,
Understanding how sea-level rise will affect coastal landforms and the species and habitats they support is critical for crafting approaches that balance the needs of humans and native species. Given this increasing need to forecast sea-level rise effects on barrier islands in the near and long terms, we are developing Bayesian networks to evaluate and to forecast the cascading effects of sea-level rise on shoreline change, barrier island state, and piping plover habitat availability. We use publicly available data products, such as lidar, orthophotography, and geomorphic feature sets derived from those, to extract metrics of barrier island characteristics at consistent sampling distances. The metrics are then incorporated...
Categories: Data;
Types: Downloadable,
GeoTIFF,
Map Service,
Raster;
Tags: Atlantic Ocean,
Barrier Island,
CMHRP,
Coastal Habitat,
Coastal and Marine Hazards and Resources Program,
Understanding how sea-level rise will affect coastal landforms and the species and habitats they support is critical for crafting approaches that balance the needs of humans and native species. Given this increasing need to forecast sea-level rise effects on barrier islands in the near and long terms, we are developing Bayesian networks to evaluate and to forecast the cascading effects of sea-level rise on shoreline change, barrier island state, and piping plover habitat availability. We use publicly available data products, such as lidar, orthophotography, and geomorphic feature sets derived from those, to extract metrics of barrier island characteristics at consistent sampling distances. The metrics are then incorporated...
Categories: Data;
Types: Downloadable,
Map Service,
OGC WFS Layer,
OGC WMS Layer,
Shapefile;
Tags: Atlantic Ocean,
Barrier Island,
CMHRP,
Coastal Hazards,
Coastal and Marine Hazards and Resources Program,
We applied spatially-explicit models to a spatiotemporally robust dataset of greater sage-grouse (Centrocercus urophasianus) nest locations and fates across wildfire-altered sagebrush ecosystems of the Great Basin ecoregion, western USA. Using sage-grouse as a focal species, we quantified scale-dependent factors driving nest site selection and nest survival across broad spatial scales in order to identify wildfire impacts and other environmental influences on variation in nesting productivity across a broad ecoregion spanning mesic and xeric shrub communities. To investigate the consequences of habitat selection and explore the potential for a source-sink reproductive landscape, we sought to classify nesting habitat...
A machine learning streamflow (MLFLOW) model was developed in R (model is in the Rscripts folder) for modeling monthly streamflow from 2012 to 2017 in three watersheds on the Wyoming Range in the upper Green River basin. Geospatial information for 125 site features (vector data are in the Sites.shp file) and discrete streamflow observation data and environmental predictor data were used in fitting the MLFLOW model and predicting with the fitted model. Tabular calibration and validation data are in the Model_Fitting_Site_Data.csv file, totaling 971 discrete observations and predictions of monthly streamflow. Geospatial information for 17,518 stream grid cells (raster data are in the Streams.tif file) and environmental...
Types: Map Service,
OGC WFS Layer,
OGC WMS Layer,
OGC WMS Service;
Tags: Ecology,
Geography,
Hydrology,
USGS Science Data Catalog (SDC),
Upper Green,

The domain of the model is as follows: Row River from Dorena dam to the confluence with the Coast Fork; Coast Fork from Cottage Grove dam to the confluence with the Middle Fork; Silk Creek from River Mile 1.7 to the confluence with the Coast Fork. The basis for these features is the Willamette Flood Insurance Study – Phase One (2013). The hydraulics and hydrology for the FIS were reused in the production of these polygons; the reports and information associated with the FIS are applicable to this product. The Digital Elevation Model (DEM) utilized for the Willamette FIS submittal was produced by combining multiple overlapping topographic surveys for the Middle Fork and Coast Fork of the Willamette River. This DEM...

The domain of the model is as follows: Row River from Dorena dam to the confluence with the Coast Fork; Coast Fork from Cottage Grove dam to the confluence with the Middle Fork; Silk Creek from River Mile 1.7 to the confluence with the Coast Fork. The basis for these features is the Willamette Flood Insurance Study – Phase One (2013). The hydraulics and hydrology for the FIS were reused in the production of these polygons; the reports and information associated with the FIS are applicable to this product. The Digital Elevation Model (DEM) utilized for the Willamette FIS submittal was produced by combining multiple overlapping topographic surveys for the Middle Fork and Coast Fork of the Willamette River. This DEM...

The domain of the model is as follows: Row River from Dorena dam to the confluence with the Coast Fork; Coast Fork from Cottage Grove dam to the confluence with the Middle Fork; Silk Creek from River Mile 1.7 to the confluence with the Coast Fork. The basis for these features is the Willamette Flood Insurance Study – Phase One (2013). The hydraulics and hydrology for the FIS were reused in the production of these polygons; the reports and information associated with the FIS are applicable to this product. The Digital Elevation Model (DEM) utilized for the Willamette FIS submittal was produced by combining multiple overlapping topographic surveys for the Middle Fork and Coast Fork of the Willamette River. This DEM...

The domain of the model is as follows: Row River from Dorena dam to the confluence with the Coast Fork; Coast Fork from Cottage Grove dam to the confluence with the Middle Fork; Silk Creek from River Mile 1.7 to the confluence with the Coast Fork. The basis for these features is the Willamette Flood Insurance Study – Phase One (2013). The hydraulics and hydrology for the FIS were reused in the production of these polygons; the reports and information associated with the FIS are applicable to this product. The Digital Elevation Model (DEM) utilized for the Willamette FIS submittal was produced by combining multiple overlapping topographic surveys for the Middle Fork and Coast Fork of the Willamette River. This DEM...
This data release contains geospatial thematic (classified) images and vector (polygon) data derived from WorldView-3 satellite imagery. Imagey was obtained during 2020–21 along the Rio Grande in Webb County, Texas. The polygon data represent the area of interest (AOI) and the analysis study area (buffer zone that extends one mile east of the Rio Grande center line) on the U.S. side of the Mexico/United States border. Arundo donax (Arundo cane, giant reed, or Carrizo cane), is an invasive bamboo-like perennial grass most common to riparian areas throughout the southwestern United States. Because it displaces native riparian vegetation, Arundo cane has greatly disrupted the health of riparian ecosystems in the southwestern...
Types: Map Service,
OGC WFS Layer,
OGC WMS Layer,
OGC WMS Service;
Tags: Arundo cane,
Arundo donax,
Botany,
Carrizo cane,
Geography,

The High Resolution National Hydrography Dataset Plus (NHDPlus HR) is an integrated set of geospatial data layers, including the National Hydrography Dataset (NHD), National Watershed Boundary Dataset (WBD), and 3D Elevation Program Digital Elevation Model (3DEP DEM). The NHDPlus HR combines the NHD, 3DEP DEMs, and WBD to a data suite that includes the NHD stream network with linear referencing functionality, the WBD hydrologic units, elevation-derived catchment areas for each stream segment, "value added attributes" (VAAs), and other features that enhance hydrologic data analysis and routing.
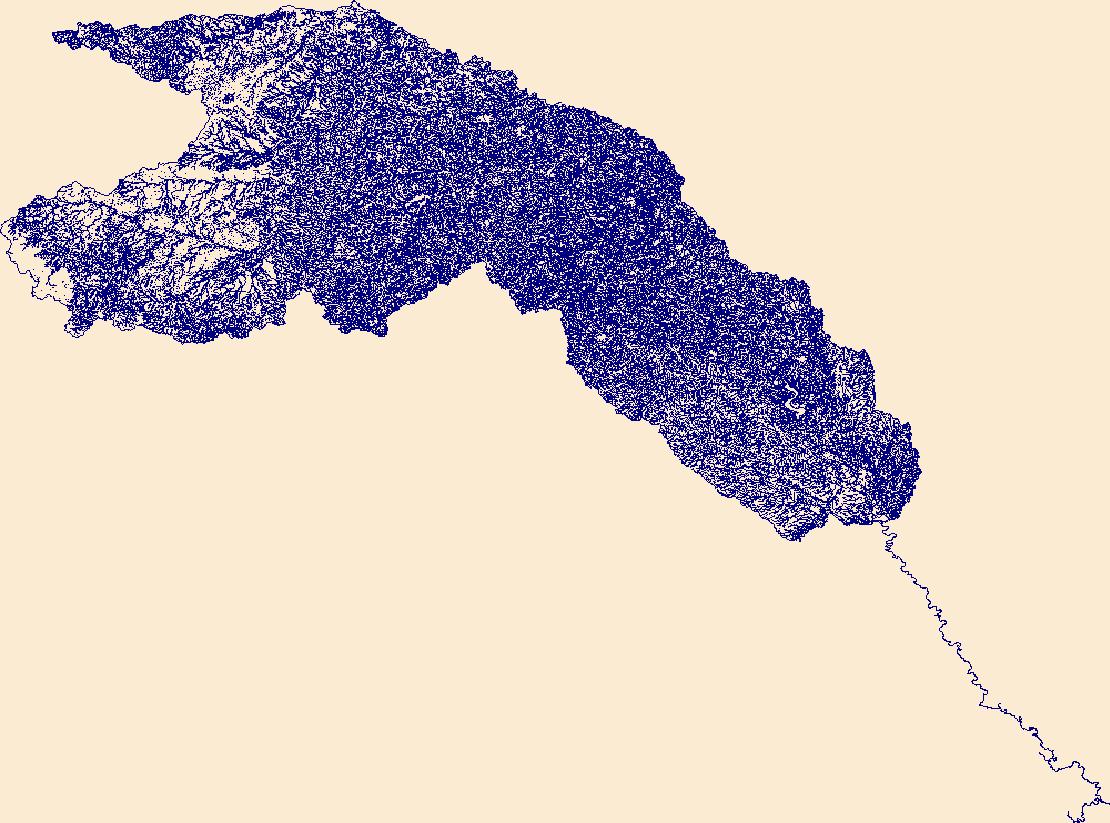
The High Resolution National Hydrography Dataset Plus (NHDPlus HR) is an integrated set of geospatial data layers, including the best available National Hydrography Dataset (NHD), the 10-meter 3D Elevation Program Digital Elevation Model (3DEP DEM), and the National Watershed Boundary Dataset (WBD). The NHDPlus HR combines the NHD, 3DEP DEMs, and WBD to create a stream network with linear referencing, feature naming, "value added attributes" (VAAs), elevation-derived catchments, and other features for hydrologic data analysis. The stream network with linear referencing is a system of data relationships applied to hydrographic systems so that one stream reach "flows" into another and "events" can be tied to and traced...

The High Resolution National Hydrography Dataset Plus (NHDPlus HR) is an integrated set of geospatial data layers, including the National Hydrography Dataset (NHD), National Watershed Boundary Dataset (WBD), and 3D Elevation Program Digital Elevation Model (3DEP DEM). The NHDPlus HR combines the NHD, 3DEP DEMs, and WBD to a data suite that includes the NHD stream network with linear referencing functionality, the WBD hydrologic units, elevation-derived catchment areas for each stream segment, "value added attributes" (VAAs), and other features that enhance hydrologic data analysis and routing.
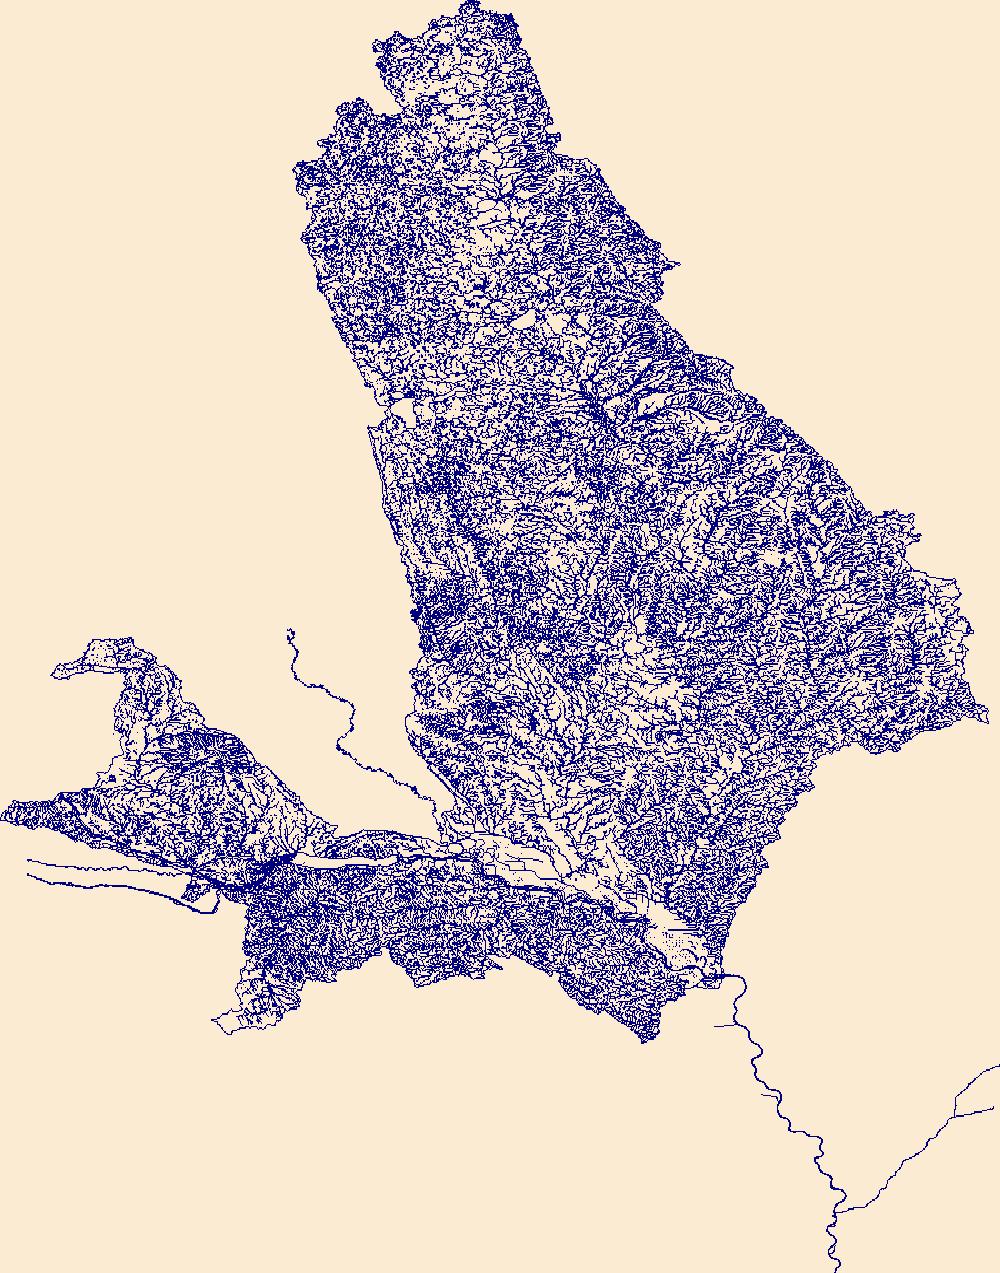
The High Resolution National Hydrography Dataset Plus (NHDPlus HR) is an integrated set of geospatial data layers, including the best available National Hydrography Dataset (NHD), the 10-meter 3D Elevation Program Digital Elevation Model (3DEP DEM), and the National Watershed Boundary Dataset (WBD). The NHDPlus HR combines the NHD, 3DEP DEMs, and WBD to create a stream network with linear referencing, feature naming, "value added attributes" (VAAs), elevation-derived catchments, and other features for hydrologic data analysis. The stream network with linear referencing is a system of data relationships applied to hydrographic systems so that one stream reach "flows" into another and "events" can be tied to and traced...
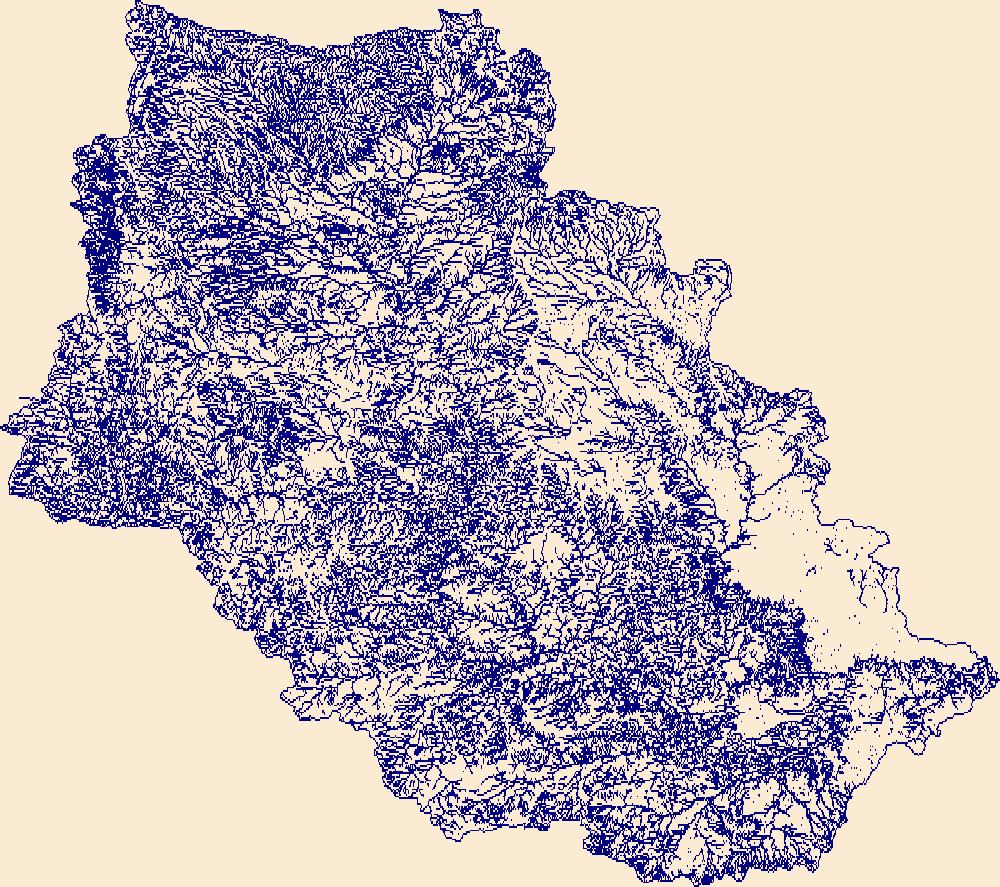
The High Resolution National Hydrography Dataset Plus (NHDPlus HR) is an integrated set of geospatial data layers, including the best available National Hydrography Dataset (NHD), the 10-meter 3D Elevation Program Digital Elevation Model (3DEP DEM), and the National Watershed Boundary Dataset (WBD). The NHDPlus HR combines the NHD, 3DEP DEMs, and WBD to create a stream network with linear referencing, feature naming, "value added attributes" (VAAs), elevation-derived catchments, and other features for hydrologic data analysis. The stream network with linear referencing is a system of data relationships applied to hydrographic systems so that one stream reach "flows" into another and "events" can be tied to and traced...
|

|
