Filters: Tags: groundwater (X) > Categories: Data Release - Revised (X)
35 results (11ms)|
Filters
Date Range
Extensions Types Contacts
Categories Tag Types
|
A three-dimensional groundwater flow model using MODFLOW-NWT was developed to evaluate historical and potential stream capture in the lower Humboldt River Basin, Nevada. The Humboldt River Basin is the only river basin that is contained entirely within the state of Nevada. The effect of groundwater pumping on the Humboldt River is not well understood. Tools are needed to determine stream capture and manage groundwater pumping in the Humboldt River Basin. Previous work has demonstrated that the river’s surface-water resource is sensitive to groundwater withdrawals, which have steadily increased since the 1950s for agriculture, municipal, and mining uses. A numerical groundwater flow model was developed for the purpose...
Categories: Data Release - Revised;
Types: Map Service,
OGC WFS Layer,
OGC WMS Layer,
OGC WMS Service;
Tags: Capture,
Groundwater Model,
Humboldt River Basin watershed,
Hydrology,
InlandWaters,
The temperature and surface geophysical data contained in this release have primarily been collected to support groundwater/surface water methods development, and to characterize the hydrogeological controls on native brook trout habitat. All data have been collected since 2010 along the Quashnet River corridor located on Cape Cod, MA, USA. Cape Cod is a peninsula in southeastern coastal Massachusetts, USA, composed primarily of highly permeable unconsolidated glacial moraine and outwash deposits. The largest of the Cape Cod sole-source aquifers occupies a western (landward) section of the peninsula, and is incised by several linear valleys that drain groundwater south to the Atlantic Ocean via baseflow-dominated...
Categories: Data Release - Revised;
Tags: Falmouth/Mashpee,
Groundwater,
InlandWaters,
Massachusetts,
Quashnet River,
The U.S. Geological Survey (USGS) developed a regression model for estimating mean August baseflow per square mile of drainage area in cooperation with National Oceanic and Atmospheric Administration (NOAA) to help resource managers assess relative amounts of baseflow in streams with Maine Atlantic Salmon habitat (Lombard and others, 2021). The model was applied to each reach of a stream network derived from select National Hydrography Dataset Plus High-Resolution (NHDPlusHR) data in the State of Maine south of 46º 21′55″ N latitude. The spatial coverage developed from the stream network contains model-estimated mean August baseflow per square mile of drainage area as an attribute of each NHDPlusHR reach. Please...
Categories: Data,
Data Release - Revised;
Types: ArcGIS REST Map Service,
ArcGIS Service Definition,
Downloadable,
Map Service,
OGC WFS Layer,
OGC WMS Layer,
OGC WMS Service;
Tags: Atlantic,
Atlantic Salmon,
August,
Distinct Population Segment,
Hydrology,
This data release provides a comprehensive dataset of sampling-site characteristics and baseline groundwater-quality data collected from a network of multilevel sampling wells installed in a densely developed coastal neighborhood undergoing a conversion from onsite septic systems to municipal sewering. Groundwater samples were collected during multiple events from a total of 227 well screens at 15 locations using a peristaltic pump between June 2016 and September 2021. Samples were collected and preserved following methods documented in the U.S. Geological Survey National Field Manual (variously dated) and Savoie and others (2012). This dataset provides well construction information, groundwater levels, water-quality...
Categories: Data,
Data Release - Revised;
Tags: Falmouth,
Mara Vista,
Massachusetts,
USGS Science Data Catalog (SDC),
groundwater,
The Sparta aquifer is a primary source of groundwater in north-central Louisiana with more than 60 million gallons of water per day being withdrawn in 2015, and public supply and Industry account for over 90 percent of the water-use demand from the Sparta aquifer (Collier, 2018). Concentrated withdrawals from the Sparta aquifer have caused regional water-level declines within the Sparta aquifer (McGee and Brantly, 2015). Widespread concern about the potential effects of declining water levels has brought forth many questions regarding the sustainability of the aquifer as well as continued saltwater intrusion. In cooperation with the Louisiana Department of Transportation and Development, the U.S. Geological Survey...
Categories: Data Release - Revised;
Types: Map Service,
OGC WFS Layer,
OGC WMS Layer,
OGC WMS Service;
Tags: Arkansas,
Kentucky,
Louisiana,
Memphis aquifer,
Mississippi,
Groundwater withdrawals are published by county and use type every 5 years by the U.S. Geological Survey (http://water.usgs.gov/watuse/) and published values often do not specify the aquifer(s) from which the withdrawals are derived. The items included in this dataset represent estimates of water use by aquifer in the southeastern United States in order to provide better insight into the 3-dimensional distribution of groundwater withdrawals in time and space.
Categories: Data,
Data Release - Revised;
Types: Map Service,
OGC WFS Layer,
OGC WMS Layer,
OGC WMS Service;
Tags: Alabama,
Florida,
Floridan,
Floridan aquifer system,
Georgia,
This Well Completion Report geospatial dataset represents an index to a subset of records available from the California Department of Water Resources' (DWR) Online System for Well Completion Reports (OSWCR). This version of the release contains data from about 255,000 well completion reports (WCRs) for water supply wells from Amador, Butte, Calaveras, Colusa, El Dorado, Glenn, Kern, Kings, Merced, Monterey, Nevada, Placer, Riverside, Sacramento, San Benito, San Bernardino, San Luis Obispo, San Joaquin, Santa Clara, Santa Cruz, Shasta, Stanislaus, Sutter, Tehama, Tulare, and Yuba counties. A subset of WCRs for wells that are not water supply wells also are included. The California Groundwater Ambient Monitoring and...
This Well Completion Report geospatial dataset represents an index to a subset of records available from the California Department of Water Resources' (DWR) Online System for Well Completion Reports (OSWCR). This release contains water supply well records from Amador, Calaveras, El Dorado, Nevada, Placer, Sacramento, San Bernardino, Sutter, and Yuba counties. The USGS California Water Science Center GAMA project has provided additional attributes: top of open interval; number of open intervals; and various other identifiers such as public supply well number and USGS site number where they can be identified. In some cases, locations are georeferenced to finer resolution based on county APN or 911 geospatial datasets....
Categories: Data,
Data Release - Revised;
Tags: California,
USGS Science Data Catalog (SDC),
Well Completion Report,
geoscientificInformation,
groundwater,
As part of the California State Water Resources Control Board’s Oil and Gas Regional Monitoring Program , the U.S. Geological Survey collected groundwater and quality-control (QC) samples during September 2016–February 2017 from 14 water-production wells located within a one-mile buffer zone of and in the Fruitvale Oil field, Kern County, California. Samples were analyzed for water-quality indicators, major and minor ions, nutrients, trace elements, volatile organic compounds, naturally occurring radioactive material, geochemical and age-dating tracers, dissolved organic carbon, dissolved standard and hydrocarbon gases, and dissolved noble and atmospheric gases. In total, 235 constituents and water-quality indicators...
Categories: Data,
Data Release - Revised;
Types: Map Service,
OGC WFS Layer,
OGC WMS Layer,
OGC WMS Service;
Tags: Bakersfield,
California,
Central Valley,
Fruitvale,
Fruitvale oil field,
Managed aquifer recharge is a water-management strategy used to meet water demands during dry periods, or periods of high-water demand, when surface-water supplies are low. One method of managed aquifer recharge uses aquifer systems as subsurface reservoirs or ‘water banks’ to effectively and economically store surface water when surplus is available, and then recover the recharged groundwater to meet water demands during droughts. During these water shortages, increased groundwater pumpage can be used to offset shortfalls in surface-water supplies. Thus, surface-water reservoirs and water banks can be used conjunctively to effectively coordinate the use of groundwater and surface water. Data were compiled for ten...
Categories: Data,
Data Release - Revised;
Types: Downloadable,
Map Service,
OGC WFS Layer,
OGC WMS Layer,
Shapefile;
Tags: California,
Central Valley,
USGS Science Data Catalog (SDC),
United States,
environment,
This U.S. Geological Survey data release provides detailed sampling site information, hole and well construction details, and data dictionaries necessary to interpret historical and future physical, chemical, and biological data sets derived from samples collected and measurements made in association with the National Crude Oil Spill Fate and Natural Attenuation Research Site. In 1979, a high-pressure pipeline carrying crude oil burst near the city of Bemidji, Minnesota and spilled approximately 1.7 million liters (10,700 barrels) of crude oil into glacial outwash deposits (Essaid and others, 2011). Since 1983, scientists with the U.S. Geological Survey, in collaboration with scientists from academic institutions,...
Understanding the number of acres of farmland irrigated and the amount of water used for irrigation is central to water-resource planning and public decision making. The U.S. Geological Survey (USGS), in cooperation with the Tennessee Department of Environment and Conservation, Division of Water Resources (TDEC-DWR), compiled available 5-year, county-level data on irrigated acres in Tennessee from 1934 to 2017 from published reports by the U.S. Census Bureau and the U.S. Department of Agriculture. Other data published in this dataset are summary statistics for irrigated acreage in Tennessee from 1934-2017, the top counties with the largest number of irrigated acres for each reporting year, as well as a county-level...
Categories: Data,
Data Release - Revised;
Tags: East Tennessee,
Middle Tennessee,
Tennessee,
USGS Science Data Catalog (SDC),
West Tennessee,
Locations of focused (or ‘preferential’) groundwater discharge to surface water are often hydrologically and ecologically important, yet our ability to predict the spatial distribution and water quality of preferential riverbank discharges is limited at the scale of river networks. To advance the understanding of the physical controls on riverbank groundwater discharge processes, discharge zones can be mapped efficiently using handheld and drone-based thermal infrared cameras. Groundwater discharge locations can be identified based on ‘anomalous’ thermal signatures, such as relatively cold riverbank zones in summer and warm riverbank zones in winter. Thermal infrared imaging can be combined with concurrent direct...
Categories: Data,
Data Release - Revised;
Types: Downloadable,
Map Service,
OGC WFS Layer,
OGC WMS Layer,
Shapefile;
Tags: Connecticut,
Farmington River,
Massachusetts,
USGS Science Data Catalog (SDC),
geoscientificInformation,
The U.S. Geological Survey (USGS), in cooperation with the Harris‐Galveston Subsidence District, City of Houston, and the Fort Bend Subsidence District, produced a dataset through 2022 of compaction values in the Chicot and Evangeline aquifers in the greater Houston area, Texas. This dataset contains compaction values associated with subsurface sediments (mostly in the fine-grained silt and clay layers because little compaction occurs in sand layers) in the Chicot and Evangeline aquifers that were recorded continuously using analog technology at 14 extensometers at 12 locations (a pair of extensometers are installed at different depths at 2 of the 12 locations). Of the 14 extensometers, 13 were activated between...
Categories: Data Release - Revised;
Tags: Chicot aquifer,
Evangeline aquifer,
Galveston County,
Harris County,
Texas,
The data set includes temperature data from the base of the water column and below the bottom of the Indian River Lagoon, Brevard County, Florida. Data were collected near Eau Gallie, Melbourne, Florida and Riverwalk Park, Rockledge, Florida, on the western shore of the Lagoon. These data will ultimately be used to evaluate groundwater seepage. Data collection includes, temperature profiling using temperature stakes and distributed temperature sensing. Temperature stakes consist of 4 to 5 temperature sensors imbedded in 0.6 to 0.9 meter long polyvinyl chloride stakes that are designed to be driven into the sediment at the bottom of the lagoon. Temperature data were collected hourly at a resolution of 0.0625...
Categories: Data Release - Revised;
Tags: Brevard County,
Florida,
Indian River Lagoon,
USGS Science Data Catalog (SDC),
flow,
This data release includes grids representing the depth and thickness of drinking-water withdrawal zones, polygons of hydrogeologic settings, an inventory of sources of well construction data, and summaries of data comparisons used to assess the depth of groundwater used for drinking-water supplies in the United States. Well construction data sources are documented in Table1_DataSources.xlsx. Data comparisons using the Mann-Whitney test to assess similarity between hydrogeologic settings were used to justify combining data where they were sparse (compare_neighbors_all_domestic.txt and compare_neighbors_all_public.txt). Water-supply-well depth varies geographically by water use and the type of well, which illustrates...
Categories: Data,
Data Release - Revised;
Types: Map Service,
OGC WFS Layer,
OGC WMS Layer,
OGC WMS Service;
Tags: Cycle 3,
Hydrology,
NAWQA,
USGS Science Data Catalog (SDC),
United States,
This dataset supercedes an earlier data release and includes all previous data in addition to data from 2019. These data represent the network-adjusted results of relative- and absolute-gravity surveys. Relative-gravity surveys were carried out using a Micro-g LaCoste D-series relative-gravity meter. The effect of solid Earth tides and ocean loading were removed from the data. Instrument drift was removed by evaluating gravity change during repeated measurements at one or more base stations. Absolute-gravity surveys were carried out using a Micro-g LaCoste, Inc. A-10 absolute-gravity meter. Vertical gradients between the different measuring heights of the absolute- and relative-gravity meters were measured using...
Categories: Data,
Data Release - Revised;
Types: Downloadable,
Map Service,
OGC WFS Layer,
OGC WMS Layer,
Shapefile;
Tags: Arizona,
Arizona Water Science Center,
Avra Valley,
Southwest Gravity Program,
Tucson,
This data release is comprised of data compiled during the construction of monitoring wells at four sentinel well sites: Trumbull, Cesar Chavez, Southern, and VA. These wells are located in southeastern Albuquerque, New Mexico (Figures 1 and 2). Between March 2013 and April 2016, the United States Geological Survey (USGS), in cooperation with the Albuquerque Bernalillo County Water Utility Authority and the U.S. Air Force Civil Engineer Center, installed 22 wells at four sites on and near Kirtland Air Force Base (KAFB). The wells, installed in response to an aviation fuel spill that was discovered in 1999 at the Bulk Fuels Facility (BFF) on KAFB, were screened at varying depths in order to characterize the aquifer...
Categories: Data,
Data Release - Revised;
Tags: Albuquerque,
Hydrogeology,
Kirtland Air Force Base,
New Mexico,
USGS Science Data Catalog (SDC),
This data release is a compilation of annual Global Navigation Satellite System (GNSS) surveys of a network of 26 vertical control points (benchmarks) in the Hampton Roads region of southeastern Virginia. Surveys are conducted annually during the winter and are structured to collect a minimum of 24-hours of position data when possible, at an interval of 30-seconds or less at each benchmark location. Raw GPS survey files are downloaded and converted to Receiver Independent Exchange Format (RINEX) and post processed using the National Oceanic and Atmospheric Administration (NOAA) National Geodetic Survey (NGS) Online User Positioning Service (OPUS) Projects 4.12 software package following guidance and best practices...
Categories: Data,
Data Release - Revised;
Tags: Hampton Roads,
Lower Chesapeake Bay,
USGS Science Data Catalog (SDC),
Virginia,
groundwater,
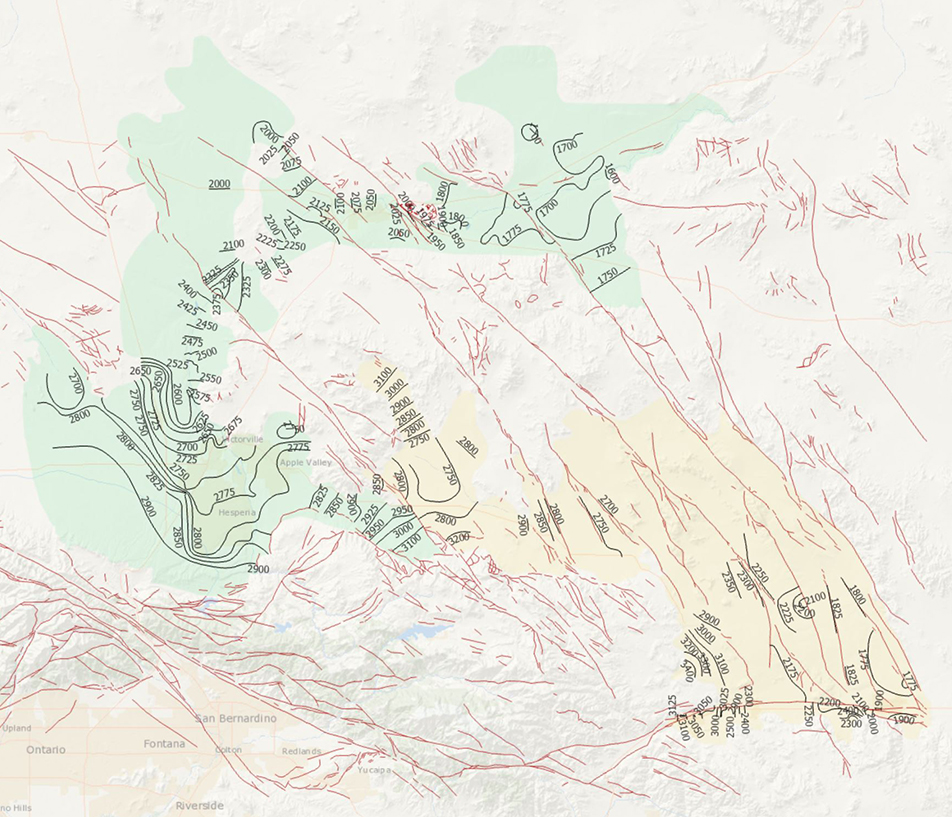
During 2014, the U.S. Geological Survey and other agencies made approximately 1,026 water-level measurements in the Mojave River and Morongo groundwater basins. These data document recent conditions and, when compared with previous data, changes in groundwater levels. A water-level contour map was drawn using data from about 610 wells, providing coverage for most of the basins. Twenty-four hydrographs show long-term (1930-2014) water-level conditions throughout the basins, and 9 short-term (1992 to 2014) hydrographs show the effects of recharge and discharge along the Mojave River. In addition, a water-level-change map was compiled to compare was compiled to compare the 2014 water levels to the 2012 water levels...
Categories: Data Release - Revised;
Tags: USGS,
USGS Science Data Catalog (SDC),
contours,
drainage basin,
ground water,
|

|
