Filters: Tags: image (X) > Date Range: {"choice":"year"} (X)
31 results (17ms)|
Filters
Date Types (for Date Range)
Contacts
Categories Tag Types
|
This data release contains time-lapse imagery taken at U.S. Geological Survey (USGS) stream gaging stations with associated hydrologic and meteorological data related to each image. These data are to help improve the development of models in detecting water elevation at a given stream gaging station. Images of the water surface and surroundings at USGS stream gaging stations were taken at varying time intervals ranging between every five minutes to an hour. Cameras used include trail cameras, web cameras, and the custom river imagery sensing (RISE) camera. Time-lapse images for each USGS stream gaging station are provided in compressed files (file extension .7z). These files are named in a format to identify the...
Categories: Data;
Types: Map Service,
OGC WFS Layer,
OGC WMS Layer,
OGC WMS Service;
Tags: Remote Sensing,
USGS Science Data Catalog (SDC),
Water Resources,
camera,
image,
Low-altitude (70 m above ground level) aerial images were collected over five areas of interest within the northern portion of Assateague Island National Seashore (ASIS) in mid-October, 2022. These images were collected to generate photogrammetric products (e.g. digital surface model (DSM), reflectance orthomosaic) to support science and data needs of National Park managers attempting to locate invasive Phragmites australis expansion. A DJI Matrice 600 uncrewed aircraft system (UAS) was equipped with a MicaSense Altum-PT multispectral camera and a Ricoh GRII true-color RGB camera to collect images simultaneously with sufficient overlap for photogrammetric processing. Ground control points (GCPs), black and white...
This project established a permafrost monitoring network in this region, providing a baseline of permafrost thermal regimes for assessing future change at a total of 26 automated monitoring stations. Stations have collected year-round temperature data from the active layer and the permafrost starting from the summer of 2011. The strong correspondence between spatial variability in permafrost thermal regime and an existing ecotype map allowed for the development of a map of ‘permafrost thermal classes’ for the broader study region. Further, the annual temperature data was used to calibrate models of soil thermal regimes as a function of climate, providing estimates of both historic and future permafrost thermal regimes...
Categories: Data,
Image;
Tags: Academics & scientific researchers,
Federal resource managers,
Image,
LCC Network Science Catalog,
PERMAFROST,
This composite shaded relief image dataset depicts generalized bathymetry and topography of the Caribbean region.
These are the images associated with the project, including: (1) OriginalImages: original 863 images provided to West Inc from USFWS and others for model training; (2) YoloSliced: 1897 programmatically cropped original images used for training a YOLO Model (300 x 300 pixels); (3) OriginalImages_Box: 785 annotated images; (4) YoloSliced_Box: 1897 annotated sliced images.
Categories: Data,
Image;
Types: Map Service,
OGC WFS Layer,
OGC WMS Layer,
OGC WMS Service;
Tags: ANIMALS/VERTEBRATES,
BIOLOGICAL CLASSIFICATION,
BIRDS,
EARTH SCIENCE,
Image,
Album caption: Section along axis of May 18, 1980, tephra deposit. Below the knife is several inches(centimeters) of material deposited by the lateral blast; above the knife is more than 6 in (15 cm) of ash and lanpilli deposited during the morning of May 18, 1980(see fig. 22) overlying these layers are coarse lapilli from the July 2, 1980, eruption.
Album caption: South side of Mount ST. Helens. Qc, Cave Basalt(Holocene; dashed lines indicate approximate boundaries. Numbers, U.S. Forest Service roads. Photograph by Austin Post, taken June 30, 1980. Handwritten notes on album caption: (Negative?).
Album caption: Northeast side of Mount St. Helen's. NFTRV, North Fork Toutle River Valley. Dashed line, U.S. Service Road 99. Photograph by Bob Krimmel, taken September 10, 1980. Handwritten notes on album caption: Negative?
Album caption and index card: Mono Craters, Mono Valley. Mono County, California. n.d. (Panorama). Index card: CALIFORNIA - MONO COUNTY. Russell, I.C. 58, 60 (Panorama).

These data were released prior to the October 1, 2016 effective date for the USGS’s policy dictating the review, approval, and release of scientific data as referenced in USGS Survey Manual Chapter 502.8 Fundamental Science Practices: Review and Approval of Scientific Data for Release. The false-color composite image of the Death Valley regional ground-water flow system (DVRFS), an approximately 100,000 square-kilometer region of southern Nevada and California, was derived from Landsat 5 Thematic Mapper (TM) data for 1996. The image is a composite of spectral bands 2, 4, and 7 in RGB (Red-Green-Blue) space. Individual bands were processed to display their full dynamic range. The image was further processed in hue-saturation...
Dr. Joseph T. Kelley collection of field photographs from his career in Maine.
Categories: Data,
Image;
Types: Collection,
Downloadable,
Map Service,
OGC WFS Layer,
OGC WMS Layer,
OGC WMS Service;
Tags: Coastal,
Field photos,
Image,
Maine,
final,
Album caption: Mount St. Helens from the Elk Rock area. A, area of debris avalanche; J, Johnston Ridge; SL, Spirit Lake. Dashed line, Weyerhaeuser Road 3540. View southeastward; photograph by Bob Krimmell, taken June 16, 1982.
Album caption: Exposed section of fan at confluence of Smith Creek and Muddy River at stop 5. Section consists of summit- dome material of the Kalama eruptive period of Mullineaux(1986) overlain by 5 ft(1.5) of May 1980 deposit.
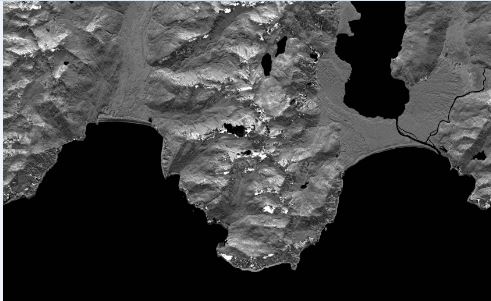
These data are orthorectified radar intensity images (ORI) derived from interferometric synthetic aperture radar (ifsar) data. An ORI is a high-resolution image derived from ifsar which has geometric distortions removed. Unlike optical imagery, ifsar can be collected in cloudy conditions. The USGS performs minimal quality assurance and no reprocessing of the ORI data. USGS distributes the ORI data as received from the contractors, partners or contributing entities.

These data were released prior to the October 1, 2016 effective date for the USGS’s policy dictating the review, approval, and release of scientific data as referenced in USGS Survey Manual Chapter 502.8 Fundamental Science Practices: Review and Approval of Scientific Data for Release. The false-color composite image of the Death Valley regional ground-water flow system (DVRFS), an approximately 100,000 square-kilometer region of southern Nevada and California, was derived from Landsat 5 Thematic Mapper (TM) data for 1996. The image is a composite of spectral bands 2, 4, and 7 in RGB (Red-Green-Blue) space. Individual bands were processed to display their full dynamic range. The image was further processed in hue-saturation...
Collection of field photos taken by MGS geologists.
Categories: Data,
Image;
Types: Collection,
Downloadable,
Map Service,
OGC WFS Layer,
OGC WMS Layer,
OGC WMS Service;
Tags: Bedrock,
Field photos,
Image,
Maine,
Mapping,
This project resulted in an extensive mapping of coastal change along the entire coastline of the Western Alaska Landscape Conservation Cooperative (LCC). The work provides important baseline information on the distribution and magnitude of landscape changes over the past 41 years. The extent of change to the coastline and to coastal features, such as spits, barrier islands, estuaries, tidal guts and lagoons, was known to be substantial in some areas along the coast (e.g., portions of the Yukon–Kuskokwim Delta), although the extent of change along the full Bering Sea coast was not well documented. With this analysis, changes can be summarized for different land ownerships or other units to assess the extent of recent...
Categories: Data,
Image;
Tags: BARRIER ISLANDS,
BARRIER ISLANDS,
BARRIER ISLANDS,
BARRIER ISLANDS,
COASTAL AREAS,
The western coastline of Alaska is highly susceptible to coastal storms, which can cause coastal erosion, flooding, and have other pernicious effects to the environment and commercial efforts. The reduction in ice coverage due to climate change could potentially increase the frequency and degree of coastal flooding and erosion. Further, estuaries and delta systems act as conduits for storm surges, so when there is less nearshore ice coverage, these systems could introduce storm surge into terrestrial environments unaccustomed to saline intrusion, flooding, or other alien biogeochemical factors.This project quantified the effect of reduced nearshore ice coverage on coastal flooding. The project developed a large...
Categories: Data,
Image;
Tags: Academics & scientific researchers,
COASTAL AREAS,
COASTAL AREAS,
COASTAL PROCESSES,
COASTAL PROCESSES,
Album caption: Air-fall tephra covers part of U.S. Forest Service Road 25 in July 1980.
A high spatial resolution storm surge model was developed for the YK Delta area to assess biological impacts of storm surges under current and future climates. Storm surges are expected to be more frequent and more severe in the YK Delta area due to climate change and sea level rise. The biological impacts in the YK Delta due to the changed storm surges could be extreme.The model was assessed with respect to measured water level data at the coast and, where available, spatial extent of inundation, for 6 storms from the period 1992 to 2011. In total, inundation projections from 9 historical storms (5 from the assessment + 4 others) were developed. For each storm, an spatial inundation index (time-integral of water...
Categories: Data,
Image;
Types: Map Service,
OGC WFS Layer,
OGC WMS Layer,
OGC WMS Service;
Tags: ARCHAEOLOGICAL AREAS,
ARCHAEOLOGICAL AREAS,
Academics & scientific researchers,
COASTAL AREAS,
COASTAL AREAS,
|

|
