Filters: Tags: mean winter precipitation (X)
11 results (86ms)|
Filters
Date Range
Extensions Types Contacts Categories Tag Types Tag Schemes |

Winter (January – March) precipitation averaged over 2046-2065 from the general circulation model PCM1 (Washington et al. 2000; Meehl et al. 2003) under the A2 emission scenario with a grid cell size of 10 km x 10km. References: Meehl, G.A., W.M. Washington, T.M.L. Wigley, J.M. Arblaster, and A. Dai. 2003. Solar and greenhouse gas forcing and climate response in the twentieth century. J Climate 16:426–444. Washington, W.M., J.W. Weatherly, G.A. Meehl, A.J. Semtner, T.W. Bettge, A.P. Craig, W.G. Stran, J. Arblaster, V.B. Wayland, R. James , and Y. Zhang. 2000. Parallel climate model (PCM) control and transient simulations. Clim Dyn 16: 755–774.

Winter (January – March) precipitation (mm) averaged over 2046-2065 from the general circulation model Hadley CM3 (Gordon et al. 2000, Pope et al. 2000) downscaled to a grid cell size of 10 km x 10km. References: Gordon C., C. Cooper , C.A. Senior, H. Banks, J.M. Gregory, T.C. Johns , J.F.B. Mitchell, and R.A. Wood. 2000. The simulation of SST, sea ice extents and ocean heat transports in a version of the Hadley Centre coupled model without flux adjustments. Clim Dyn 16:147–168. Pope, V.D., M.L. Gallani, P.R. Rowntree, and R.A. Stratton. 2000. The impact of new physical parameterisations in the Hadley Centre climate model – HadAM3. Clim Dyn 16:123–146.
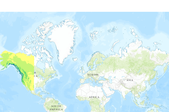
This set of 4 rasters shows winter (Dec to Feb) precipitation (mm) for Western North America under the B1 Emissions Scenario from the Intergovernmental Panel on Climate Change (IPCC). One layer shows the historic period (1961 to 1990), and there are three layers of future climate projections representing the 2020s, the 2050s, and the 2080s. These future layers are ensemble averages across all 23 CMIP3 AOGCMs (Coupled Model Intercomparison Project 3 Atmosphere-Ocean General Circulation Models). All layers have a resolution of 1 km, and are designed to capture climate gradients, temperature inversions, and rain shadows in the mountainous landscape of western North America. These data, originally published here, were...
Categories: Data;
Types: ArcGIS REST Map Service,
ArcGIS Service Definition,
Downloadable,
Map Service;
Tags: 2020s,
2050s,
2080s,
B1,
ClimateWNA,
This set of 4 rasters shows winter (Dec to Feb) precipitation (mm) for Western North America under the A2 Emissions Scenario from the Intergovernmental Panel on Climate Change (IPCC). One layer shows the historic period (1961 to 1990), and there are three layers of future climate projections representing the 2020s, the 2050s, and the 2080s. These future layers are ensemble averages across all 23 CMIP3 AOGCMs (Coupled Model Intercomparison Project 3 Atmosphere-Ocean General Circulation Models). All layers have a resolution of 1 km, and are designed to capture climate gradients, temperature inversions, and rain shadows in the mountainous landscape of western North America. These data, originally published here, were...
Categories: Data;
Types: ArcGIS REST Map Service,
ArcGIS Service Definition,
Downloadable,
Map Service;
Tags: 2020s,
2050s,
2080s,
A2,
ClimateWNA,

This set of 4 rasters shows winter (Dec to Feb) precipitation (mm) for Western North America under the A1B Emissions Scenario from the Intergovernmental Panel on Climate Change (IPCC). One layer shows the historic period (1961 to 1990), and there are three layers of future climate projections representing the 2020s, the 2050s, and the 2080s. These future layers are ensemble averages across all 23 CMIP3 AOGCMs (Coupled Model Intercomparison Project 3 Atmosphere-Ocean General Circulation Models). All layers have a resolution of 1 km, and are designed to capture climate gradients, temperature inversions, and rain shadows in the mountainous landscape of western North America.

Winter (January – March) precipitation averaged over 2076-2095 from the general circulation model PCM1 (Washington et al. 2000; Meehl et al. 2003) under the A2 emission scenario with a grid cell size of 10 km x 10km. References: Meehl, G.A., W.M. Washington, T.M.L. Wigley, J.M. Arblaster, and A. Dai. 2003. Solar and greenhouse gas forcing and climate response in the twentieth century. J Climate 16:426–444. Washington, W.M., J.W. Weatherly, G.A. Meehl, A.J. Semtner, T.W. Bettge, A.P. Craig, W.G. Stran, J. Arblaster, V.B. Wayland, R. James , and Y. Zhang. 2000. Parallel climate model (PCM) control and transient simulations. Clim Dyn 16: 755–774.
This set of 4 rasters shows winter (Dec to Feb) precipitation (mm) for Western North America under the B1 Emissions Scenario from the Intergovernmental Panel on Climate Change (IPCC). One layer shows the historic period (1961 to 1990), and there are three layers of future climate projections representing the 2020s, the 2050s, and the 2080s. These future layers are ensemble averages across all 23 CMIP3 AOGCMs (Coupled Model Intercomparison Project 3 Atmosphere-Ocean General Circulation Models). All layers have a resolution of 1 km, and are designed to capture climate gradients, temperature inversions, and rain shadows in the mountainous landscape of western North America.

This set of 4 rasters shows winter (Dec to Feb) precipitation (mm) for Western North America under the A2 Emissions Scenario from the Intergovernmental Panel on Climate Change (IPCC). One layer shows the historic period (1961 to 1990), and there are three layers of future climate projections representing the 2020s, the 2050s, and the 2080s. These future layers are ensemble averages across all 23 CMIP3 AOGCMs (Coupled Model Intercomparison Project 3 Atmosphere-Ocean General Circulation Models). All layers have a resolution of 1 km, and are designed to capture climate gradients, temperature inversions, and rain shadows in the mountainous landscape of western North America.
This set of 4 rasters shows winter (Dec to Feb) precipitation (mm) for Western North America under the A1B Emissions Scenario from the Intergovernmental Panel on Climate Change (IPCC). One layer shows the historic period (1961 to 1990), and there are three layers of future climate projections representing the 2020s, the 2050s, and the 2080s. These future layers are ensemble averages across all 23 CMIP3 AOGCMs (Coupled Model Intercomparison Project 3 Atmosphere-Ocean General Circulation Models). All layers have a resolution of 1 km, and are designed to capture climate gradients, temperature inversions, and rain shadows in the mountainous landscape of western North America. These data, originally published here,...
Categories: Data;
Types: ArcGIS REST Map Service,
ArcGIS Service Definition,
Downloadable,
Map Service;
Tags: 2020s,
2050s,
2080s,
A1B,
ClimateWNA,

Winter (January – March) precipitation (mm) averaged over 1986 – 2005, with a grid cell size of 10 km x 10km, provided by the PRISM group (Daly et al. 1994). wppt_f0

This set of 4 rasters shows winter (Dec to Feb) precipitation (mm) for Western North America under the A1B Emissions Scenario from the Intergovernmental Panel on Climate Change (IPCC). One layer shows the historic period (1961 to 1990), and there are three layers of future climate projections representing the 2020s, the 2050s, and the 2080s. These future layers are ensemble averages across all 23 CMIP3 AOGCMs (Coupled Model Intercomparison Project 3 Atmosphere-Ocean General Circulation Models). All layers have a resolution of 1 km, and are designed to capture climate gradients, temperature inversions, and rain shadows in the mountainous landscape of western North America.
|

|
