Filters: Tags: model (X)
737 results (50ms)|
Filters
Date Range
Extensions Types Contacts
Categories Tag Types Tag Schemes |

NARCCAP: http://www.narccap.ucar.edu/ The North American Regional Climate Change Assessment Program (NARCCAP) is an international program that will serve the climate scenario needs of the United States, Canada, and northern Mexico. NARCCAP is systematically investigating the uncertainties in future climate projections on the regional level. NARCCAP closely matches the regional climate models (RCMs) with multiple atmosphere-ocean general circulation models (AOGCMs) along with the A2 scenario from the Special Report on Emission Scenarios (SRES) over an area covering most of North America. NARCCAP also validates the regional climate model performance by driving the RCMs with reanalyses, which is similar to driving...

NARCCAP: http://www.narccap.ucar.edu/ The North American Regional Climate Change Assessment Program (NARCCAP) is an international program that will serve the climate scenario needs of the United States, Canada, and northern Mexico. NARCCAP is systematically investigating the uncertainties in future climate projections on the regional level. NARCCAP closely matches the regional climate models (RCMs) with multiple atmosphere-ocean general circulation models (AOGCMs) along with the A2 scenario from the Special Report on Emission Scenarios (SRES) over an area covering most of North America. NARCCAP also validates the regional climate model performance by driving the RCMs with reanalyses, which is similar to driving...

NARCCAP: http://www.narccap.ucar.edu/ The North American Regional Climate Change Assessment Program (NARCCAP) is an international program that will serve the climate scenario needs of the United States, Canada, and northern Mexico. NARCCAP is systematically investigating the uncertainties in future climate projections on the regional level. NARCCAP closely matches the regional climate models (RCMs) with multiple atmosphere-ocean general circulation models (AOGCMs) along with the A2 scenario from the Special Report on Emission Scenarios (SRES) over an area covering most of North America. NARCCAP also validates the regional climate model performance by driving the RCMs with reanalyses, which is similar to driving...

NARCCAP: http://www.narccap.ucar.edu/ The North American Regional Climate Change Assessment Program (NARCCAP) is an international program that will serve the climate scenario needs of the United States, Canada, and northern Mexico. NARCCAP is systematically investigating the uncertainties in future climate projections on the regional level. NARCCAP closely matches the regional climate models (RCMs) with multiple atmosphere-ocean general circulation models (AOGCMs) along with the A2 scenario from the Special Report on Emission Scenarios (SRES) over an area covering most of North America. NARCCAP also validates the regional climate model performance by driving the RCMs with reanalyses, which is similar to driving...

MC1 is a dynamic vegetation model for estimating the distribution of vegetation and associated ecosystem fluxes of carbon, nutrients, and water. It was created to assess the potential impacts of global climate change on ecosystem structure and function at a wide range of spatial scales from landscape to global. The model incorporates transient dynamics to make predictions about the patterns of ecological change. MC1 was created by combining physiologically based biogeographic rules defined in the MAPSS model with a modified version of the biogeochemical model, CENTURY. MC1 includes a fire module, MCFIRE, that mechanistically simulates the occurrence and impacts of fire events. Climate input data sources for this...
Cheatgrass (Bromus tectorum L.) has come to dominate millions of hectares of rangeland in the Intermountain western United States. Previous studies have hypothesized that one mechanism conferring a competitive advantage to this species is the ability to germinate rapidly at low temperatures in the fall, winter and spring and, therefore, initiate growth and establishment more rapidly than more desirable perennial bunchgrass species. In this experiment, we developed thermal-germination-response models for multiple seedlots of cheatgrass and five perennial grass species. We conducted sensitivity analysis on potential-cumulative-germination response to a 38-year simulation of field-variable conditions of seedbed temperature...
Categories: Publication;
Types: Citation,
Journal Citation;
Tags: Environmental and Experimental Botany,
bromus tectorum,
elymus elymoides,
elymus multisetus,
germination,

Change in the majority generalized vegetation type for each HUC5 watershed between historical (1971-2000) and future (2071-2100) time periods. The MC1 dynamic vegetation model was run under the CSIRO, MIROC, and Hadley climate change projections and the A2 anthropogenic emissions scenario. Majority generalized vegetation type was determined for each HUC5 watershed from from original ~ 4 km raster data. Generalized vegetation types were assigned by combining detailed MC1 vegetation classes into four general catagories: desert, grassland, shrubland, and forest. Watersheds represent 5th level (HUC5, 10-digit) hydrologic unit boundaries and were acquired from the Natural Resources Conservation Service. Background:...

This map represents the percent change in total ecosystem carbon from 1971-2000 to 2070-2099, simulated by the model MC1 under the Hadley future climate projection and A2 anthropogenic emissions scenario. The average annual value of total ecosystem carbon for the respective 30-year periods decreased in some of the 5,311 grid cells of the Eastern Oregon study area and increased in others.The range of data values is from -18.2% to +194.1%. The mean value is -78.0% The vegetation model MC1 (e.g. Bachelet et al. 2001) was used to simulate vegetation dynamics, associated carbon and nitrogen cycle, water budget, and wild fire impacts at two study sites, one in eastern Oregon (Deschutes and Fremont-Winema National Forests)...

This map represents the difference in annual minimum temperatures, simulated by the model MC1 between the 30-year periods 1971-2000 and 2070-2099, using the Hadley future climate projection under the A2 anthropogenic emission scenario. The average annual minimum temperature for the respective 30-year periods increased in all of the 5,311 grid cells of the Apache-Sitgreaves study area. The greatest increase was 4.35 C; the least increase was 4.26 C; and the mean increase was 4.31 C. The vegetation model MC1 (e.g. Bachelet et al. 2001) was used to simulate vegetation dynamics, associated carbon and nitrogen cycle, water budget, and wild fire impacts at two study sites in eastern Oregon (Deschutes and Fremont-Winema...

NARCCAP: http://www.narccap.ucar.edu/ The North American Regional Climate Change Assessment Program (NARCCAP) is an international program that will serve the climate scenario needs of the United States, Canada, and northern Mexico. NARCCAP is systematically investigating the uncertainties in future climate projections on the regional level. NARCCAP closely matches the regional climate models (RCMs) with multiple atmosphere-ocean general circulation models (AOGCMs) along with the A2 scenario from the Special Report on Emission Scenarios (SRES) over an area covering most of North America. NARCCAP also validates the regional climate model performance by driving the RCMs with reanalyses, which is similar to driving...

This map represents the mean for the 30 year period 1971-2000 of the annual peak value of the fraction of live vegetation carbon which is in herbaceous (as opposed to woody) vegetation. The data is from output variable GFRAC in MC1 version B60. The data values are unitless fractions and range from 0 to 1. The vegetation model MC1 (e.g. Bachelet et al. 2001) was used to simulate vegetation dynamics, associated carbon and nitrogen cycle, water budget, and wild fire impacts at two study sites in eastern Oregon (Deschutes and Fremont-Winema National Forests) and in Arizona (Apache Sitgreaves National Forest area) in the context of a project funded by the USDA Forest Service (PNW 09-JV-11261900-003). Historical climate...
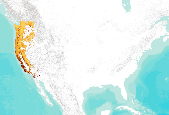
Introduction : Swainson’s Thrush is a medium sized (15-18cm) thrush which prefers to breed in dense shrub growth associated with spruce-fir forests. The "russet-backed" race prefers mixed forests and deciduous riparian woodlands of the coastal region from British Columbia, to northern California. These Pacific populations winter in mature tropical and secondary forests of Central America, whereas the "olive-backed" race that breeds in the Boreal and Rockies winters in S. America. Models of Monitoring Avian Productivity and Survival (MAPS) demographic data and high-resolution land cover data showed that Swainson’s Thrush prefers large intact forest patches with low perimeter to area ratios. On a regional...

Percent change in the average surface runoff for each HUC5 watershed between historical (1971-2000) and future (2071-2100) time periods. The MC1 dynamic vegetation model was run under the CSIRO, MIROC, and Hadley climate change projections and the A2 anthropogenic emissions scenario.Simulated mean annual surface runoff (in mm H2O yr-1), was determined for each HUC5 watershed by averaging values of original ~ 4 km raster data. Watersheds represent 5th level (HUC5, 10-digit) hydrologic unit boundaries and were acquired from the Natural Resources Conservation Service. Background: The dynamic global vegetation model MC1 (see Bachelet et al. 2001) was used to simulate vegetation dynamics, associated carbon and nitrogen...

Percent change in the mean area burned per year (per ~4 km pixel ) for each HUC5 watershed between historical (1971-2000) and future (2071-2100) time periods. The MC1 dynamic vegetation model was run under the CSIRO, MIROC, and Hadley climate change projections and the A2 anthropogenic emissions scenario.Mean area burned per year per ~4 km pixel, (in square meters), was determined for each HUC5 watershed. Watersheds represent 5th level (HUC5, 10-digit) hydrologic unit boundaries and were acquired from the Natural Resources Conservation Service. Background: The dynamic global vegetation model MC1 (see Bachelet et al. 2001) was used to simulate vegetation dynamics, associated carbon and nitrogen cycle, water budget,...
This data release contains inputs for and outputs from hydrologic simulations of the upper Chattahoochee River Basin in northeast Georgia using the Precipitation Runoff Modeling System (PRMS). These simulations were developed to provide example applications of enhancements to the PRMS for the following topics: two new time-series input options (dynamic parameter module and water-use module), two new output options (Hydrologic Response Unit (HRU) summary output module and basin variables summary output module), and three updates of existing capabilities (stream and lake flow routing module, surface-depression storage and flow simulation, and the initial-conditions specification). These PRMS model input and output...
Categories: Data;
Tags: Chattahoochee River,
USGS Science Data Catalog (SDC),
model,
streamflow,
streamflow modeling

This dataset corresponds to statistically downscaled and reprojected GCM-driven RegCM3 (regional climate model) future projections. Data were bias corrected using the delta/anomaly method whereby the difference between future and historical projections from RegCM3 were calculated, reprojected and downscaled using linear interpolation to then modify a PRISM model generated historical baseline (1968-1999).

This dataset represents the difference between future and historic maximum temperatures under the CSIRO A2 future climate scenario.

Ken Ferschweiler (CBI) used climate data from the PRISM group (Chris Daly, Oregon State University) at 4kmx4km spatial grain across the conterminous USA to generate a climatology or baseline. He then created future climate change scenarios using statistical downscaling and created anomalies from the Hadley CM3 General Circulation Model (GCM) run through the A2 emission scenario (SRES - special report on emission scenarios published in 2000). To run the MAPSS model (Neilson 1995), average monthly precipitation values were calculated for the period 2045-2060. This dataset shows the standard deviation of the annual precipitation for that period.

This collection of layers includes summary statistics from input and output data used for simulation of vegetation response to climate change in California. The historical data layers represent the 30 year period from 1961 to 1990. Future data layers represent each four 20 year periods: 2010-2029, 2030-2049, 2060-2079, and 2080-2099. The simulations were performed using MC1 dynamic global vegetation model (DGVM), source code revision 152. The model was parameterized and evaluated by the DGVM research group at the US Forest Service Pacific Northwest Research Station, with support from the Western Wildland Environmental Threat Assessment Center. The model was parameterized to maximize concordance with maps of potential...

This map shows the predicted area of high fire potential for the current year up to the end of the forecast period as simulated by a modified version of the MC1 Dynamic General Vegetation Model (DGVM). Different colors indicate the level of consensus among five different MC1 simulations (i.e., one for each forecast provided by five different weather models), ranging from one of five to five of five simulations predicting high fire potential. The area of high fire potential is where PDSI and MC1-calculated values of potential fire behavior (fireline intensity for forest and shrubland and rate of spread of spread for grassland) exceed calibrated threshold values. Potential fire behavior in MC1 is estimated using...
|

|
