Filters: Tags: nhdplus (X)
209 results (11ms)|
Filters
Date Range
Extensions Types
Contacts
Categories Tag Types
|
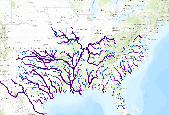
Ecologically relevant river size classes for NHDPlus v1 flowlines in the 14 state SARP region. Size class was determined for each river flowline using the cumulative drainage area from NHDPlus v1 dataset. The data are scaled to show the largest rivers at the regional scale. Zoom into the map for smaller rivers, creeks, and headwaters. For more information about how this attribute was developed by the Southern Instream Flow Network (SIFN), go to http://www.southeastaquatics.net/sarps-programs/sifn/instream-flow-resourcesYour comments about this dataset are welcome. Please send comments to the dataset author using the Comment tab below.Â
(Hyperlink to Official Landing Page for Geospatial Fabric products) The Geospatial Fabric provides a consistent, documented, and topologically connected set of spatial features that create an abstracted stream/basin network of features useful for hydrologic modeling.The GIS vector features contained in this Geospatial Fabric (GF) data set cover the lower 48 U.S. states, Hawaii, and Puerto Rico. Four GIS feature classes are provided for each Region: 1) the Region outline ("one"), 2) Points of Interest ("POIs"), 3) a routing network ("nsegment"), and 4) Hydrologic Response Units ("nhru"). A graphic showing the boundaries for all Regions is provided at http://dx.doi.org/doi:10.5066/F7542KMD. These Regions are identical...

Ecologically relevant river elevation classes for NHDPlus v1 flowlines in the 14 state SARP region. Elevation was derived from the NHDPlus v1 dataset. For more information about how this attribute was developed by the Southern Instream Flow Network (SIFN), go to http://www.southeastaquatics.net/sarps-programs/sifn/instream-flow-resourcesYour comments about this dataset are welcome. Please send comments to the dataset author using the Comment tab below.Â
The NHDPlus Version 1.0 is an integrated suite of application-ready geospatial data sets that incorporate many of the best features of the National Hydrography Dataset (NHD) and the National Elevation Dataset (NED). The NHDPlus includes a stream network (based on the 1:100,000-scale NHD), improved networking, naming, and "value-added attributes" (VAA's). NHDPlus also includes elevation-derived catchments (drainage areas) produced using a drainage enforcement technique first broadly applied in New England, and thus dubbed "The New-England Method". This technique involves "burning-in" the 1:100,000-scale NHD and when available building "walls" using the national Watershed Boundary Dataset (WBD). The resulting modified...
This tabular data set represents the average number of consecutive days with measurable precipitation for the period between 1871 and 1997, compiled for two spatial components of the NHDPlus version 2 data suite (NHDPlusv2) for the conterminous United States; 1) individual reach catchments and 2) reach catchments accumulated upstream through the river network. This dataset can be linked to the NHDPlus version 2 data suite by the unique identifier COMID. The source data is from the United States Historical Climatology Network Daily Temperature, Precipitation, and Snow Data for 1871-1997, compiled by the Oak Ridge National Laboratory (ORNL, 1999) and further processed by the USGS (Dave Wolock, written communic., 2001)....
This tabular data set represents the 30 year average (1961-1990) number of days of measurable precipitation per month, compiled for two spatial components of the NHDPlus version 2 data suite (NHDPlusv2) for the conterminous United States; 1) individual reach catchments and 2) reach catchments accumulated upstream through the river network. This dataset can be linked to the NHDPlus version 2 data suite by the unique identifier COMID. The source data for the 30 year average (1961-1990) number of days of measurable precipitation per month was provided by the Environmental Protection Agency and is included with this data set (prism-wetdays-monthly.zip provided by Ryan Hill, EPA, written commun., 2012). Units are days...
This tabular data set represents the percent of land cover classes from the 2019 edition of the National Land Cover databases for the years 2001, 2004, 2006, 2008, 2011, 2013, 2016 and 2019 compiled for two spatial components of the NHDPlus version 2.1 data suite (NHDPlusv2) for the conterminous United States; 1) individual reach catchments and 2) reach catchments accumulated upstream through the river network. These databases can be linked to the NHDPlus version 2 data suite by the unique identifier COMID. The source data is the "National Land Cover Database (NLCD) 2019 Products (ver. 2.0, June 2021)" databases for the years 2001, 2004, 2006, 2008, 2011, 2013, 2016, and 2019 produced by the United States Geological...
This tabular data set represents monthly average temperature values (Celsius) described in Wolock and McCabe (2018), compiled for the NHDPlus version 2 data suite (NHDPlusV2) for the conterminous United States. Linkage of the temperature data with NHDPlusV2 is achieved through the common unique identifier COMID. The temperature values are estimated both for: 1) individual reach catchments and 2) reach catchments accumulated upstream through the river network. The reach catchment information characterizes data at the local scale, whereas the catchments accumulated through the river network characterize cumulative upstream conditions. The network-accumulated values are derived using two methods: 1) divergence routing...
This tabular data set represents the percent of surficial materials compiled for two spatial components of the NHDPlus version 2 data suite (NHDPlusv2) for the conterminous United States; 1) individual reach catchments and 2) reach catchments accumulated upstream through the river network. This dataset can be linked to the NHDPlus version 2 data suite by the unique identifier COMID. The source data is the "Digital data set describing surficial geology in the conterminous US," produced by the United States Geological Survey (Price and Clawges, 1999). Units are percent. Reach catchment information characterizes data at the local scale. Reach catchments accumulated upstream through the river network characterizes cumulative...
This tabular data set represents the percent of surficial materials compiled for two spatial components of the NHDPlus version 2 data suite (NHDPlusv2) for the conterminous United States; 1) individual reach catchments and 2) reach catchments accumulated upstream through the river network. This dataset can be linked to the NHDPlus version 2 data suite by the unique identifier COMID. The source data is the "Map database for surficial materials in the conterminous United States" produced by the United States Geological Survey (USGS, 2009). Units are percent. Surficial materials are defined as an unconsolidated blanket of sediments in which soils commonly are developed. These sediments generally were eroded from underlying...
This tabular data set represents the number and density of major National Pollutant Discharge Elimination System (NPDES) sites, as defined by Environmental Protection Agency (EPA), compiled for two spatial components of the NHDPlus version 2 data suite (NHDPlusv2) for the conterminous United States; 1) number and desnity of major sites per individual reach catchments and 2) number and density of major sites accumulated upstream through the river network. This dataset can be linked to the NHDPlus version 2 data suite by the unique identifier COMID. The source data was acquired by James Falcone (USGS, written commun., 2010) from the EPA. Reach catchment information characterizes data at the local scale. Reach catchments...
This tabular data set represents Principal Aquifers and Rock Types compiled for two spatial components of the NHDPlus version 2 data suite (NHDPlusv2) for the conterminous United States; 1) individual reach catchments and 2) reach catchments accumulated upstream through the river network. This dataset can be linked to the NHDPlus version 2 data suite by the unique identifier COMID. The source data is the "Principal Aquifers of the 48 Conterminous United States, Hawaii, Puerto Rico, and the U.S. Virgin Islands," produced by U.S. Geological Survey, 2003. Units are percent of catchment underlain by each Principal Aquifer. Reach catchments accumulated upstream through the river network characterizes cumulative upstream...
Types: Citation;
Tags: Aquifer rock type,
Catchment,
Conterminous United States,
Inlandwaters,
NAWQA,
This tabular data set represents the percent of land cover classes from the 2014 Crop land Data Layer compiled for two spatial components of the NHDPlus version 2 data suite (NHDPlusv2) for the conterminous United States; 1) individual reach catchments and 2) reach catchments accumulated upstream through the river network. This dataset can be linked to the NHDPlus version 2 data suite by the unique identifier COMID. The source data is the "2014 Crop Land Data Layer" produced by the United States Department of Agriculture (USDA) National Agricultural Statistics Service (NASS, 2015). Reach catchment information characterizes data at the local scale. Reach catchments accumulated upstream through the river network characterizes...
Categories: Data;
Types: Citation;
Tags: CDL,
Catchment,
Conterminous United States,
Crop Land Data Layer,
CropScape,

These data were released prior to the October 1, 2016 effective date for the USGS’s policy dictating the review, approval, and release of scientific data as referenced in USGS Survey Manual Chapter 502.8 Fundamental Science Practices: Review and Approval of Scientific Data for Release. This dataset represents 19,031 basin boundaries and their streamgage locations for the U.S. Geological Survey's (USGS) active and historical streamgages from the published dataset of Stewart and others (2006) and its subsequent updates (D.W. Stewart, USGS, written commun., 2011). Only the basin boundaries that were delineated within 15 percent of the basin area reported in the National Water Information System (NWIS) were included...

These data were released prior to the October 1, 2016 effective date for the USGS’s policy dictating the review, approval, and release of scientific data as referenced in USGS Survey Manual Chapter 502.8 Fundamental Science Practices: Review and Approval of Scientific Data for Release. This data set represents the average monthly maximum temperature in Celsius multiplied by 100 for 2002 compiled for every catchment of NHDPlus for the conterminous United States. The source data were the Near-Real-Time High-Resolution Monthly Average Maximum/Minimum Temperature for the Conterminous United States for 2002 raster dataset produced by the Spatial Climate Analysis Service at Oregon State University. The NHDPlus Version...
This product consists of time-series calculations of anthropogenic characteristics derived for 16 data themes for multiple scales covering the conterminous United States. The characteristics are those which (a) have consistent data sources, and (b) have the potential to affect the water quality of streams and rivers. All 16 data themes are provided for Hydrologic Unit Code level-10 (HUC-10) boundaries (n = 15,458). Additionally, measures of land use and imperviousness are provided for U.S. Environmental Protection Agency (USEPA) Level 4 ecoregions (n = 967) and for U.S. counties (n = 3,109). The data may be scaled up to broader areas; that is, HUC-10 data may be scaled up to HUC-8, 6, 4, or HUC-2 areas, Level 4...
Categories: Data;
Tags: Atmospheric Deposition,
Census of Agriculture,
Conservation Practices,
Conterminous US,
Crop Reserve Program,

The SARP Flow Alteration Assessment provides a regional characterization of the distribution and risk of flow regime impairment of streams and rivers by anthropogenic sources at the NHD+ segment scale. This map illustrates the cumulative risk of flow alteration (RFA) from surface water use for thermopower generation in Oklahoma.  Water use is based on state permits for surface water withdrawals and returns.  The risk is based on the volume of water used monthly in the drainage area relative to the monthly volume of flow.  Risk of Flow Alteration categories:  ZERO     - 0% mean monthly flow depletion,  LOW      - > 0-10%,  MEDIUM - > 10-20%,  HIGH      - >20-100%, and  PROVISIONAL...

River classification by months of high and low flow and range of variability.  Original gage point data was extrapolated to near by areas using the Watershed Boundary Dataset, the Baseflow Index grid, gage data, and expert review.For more information about the hydrologic classes and how this attribute was developed for the Southern Instream Flow Network (SIFN), go to attached report or visit http://www.southeastaquatics.net/sarps-programs/sifn/instream-flow-resources.  Your comments about this map and the attribute databases are welcome. Please send comments to the map author using the comment tab below.
These data depict the National Hydrography Dataset Plus Version 2.1 (NHDPlusV2.1) flowline representation of the National Wild and Scenic Rivers System throughout the conterminous United States as of 2018. U.S. Forest Service geospatial data on National Wild and Scenic River segments (USFS WSR Segment) from 3/1/2016 were joined to the NHDPlusV2.1 to create the Wild and Scenic Rivers 2018 Linked to the NHDPlusV2.1 (wsr_nhdpv2.1) data. To ensure these data correctly represented the NHDPlusV2.1 flowline delineation of the National Wild and Scenic Rivers System, each wsr_nhdpv2.1 river segment was examined against the USFS WSR Segment data to check for duplication and/or omission of Wild and Scenic River segments. Spatial...
Categories: Data;
Types: Map Service,
OGC WFS Layer,
OGC WMS Layer,
OGC WMS Service;
Tags: Alabama,
Arizona,
Arkansas,
California,
Colorado,
These data were released prior to the October 1, 2016 effective date for the USGS’s policy dictating the review, approval, and release of scientific data as referenced in USGS Survey Manual Chapter 502.8 Fundamental Science Practices: Review and Approval of Scientific Data for Release. Perennial streams in Idaho have been modeled using regression equations for 7-day, 2-year low flows (7Q2) described in Wood and others (2009, U.S. Geological Survey Scientific Investigations Report 2009-5015). The model produces "synthetic" streams based on 10-meter resolution digitial elevation models that have been processed to agree closely with 1:24,000-scale National Hydrography Dataset flowlines. See Larger_Work_Citation report...
|

|
