Filters: Tags: north america (X) > Date Range: {"choice":"year"} (X)
148 results (139ms)|
Filters
Date Types (for Date Range)
Types Contacts
Categories Tag Types
|
Across the country, public land managers make hundreds of decisions each year that influence landscapes and ecosystems within the lands they manage. Many of these decisions involve vegetation manipulations known as land treatments. Land treatments include activities such as removal or alteration of plant biomass, seeding burned areas, and herbicide applications. Data on these land treatments historically have been stored at local offices and gathering information across large spatial areas was difficult. These valuable data needed to be centralized and stored for Federal agencies involved in land treatments because these data are useful to land managers for policy and management and to scientists for developing...
The U.S. Geological Survey (USGS) has compiled national shoreline data for more than 20 years to document coastal change and serve the needs of research, management, and the public. Maintaining a record of historical shoreline positions is an effective method to monitor national shoreline evolution over time, enabling scientists to identify areas most susceptible to erosion or accretion. These data can help coastal managers and planners understand which areas of the coast are vulnerable to change. This data release includes two new mean high water (MHW) shorelines extracted from lidar data collected in 2010 and 2017-2018. Previously published historical shorelines for South Carolina (Kratzmann and others, 2017)...
Categories: Data;
Types: Downloadable,
Map Service,
OGC WFS Layer,
OGC WMS Layer,
Shapefile;
Tags: Atlantic Coast,
Atlantic Coast,
Baseline,
DSAS,
Digital Shoreline Analysis System,
These data were released prior to the October 1, 2016 effective date for the USGS’s policy dictating the review, approval, and release of scientific data as referenced in USGS Survey Manual Chapter 502.8 Fundamental Science Practices: Review and Approval of Scientific Data for Release. These datasets consist of a workspace (folder) containing a collection of gridded datasets plus a personal geodatabase containing several vector datasets. These datasets are designed to be used with the ArcHydro Tools, developed by ESRI in partnership with the U.S. Geological Survey, StreamStats Development Team. The datasets, together with the ArcHydro Tools, allow users to delineate watersheds and compute several watershed characteristics....
This file (wymt_ffa_2022B_WATSTORE.txt) contains peak-flow input data for PeakFQ for peak-flow frequency analyses for selected streamgages based on data through water year 2022. The file format is called WATSTORE (National Water Data Storage and Retrieval System) available from NWISWeb (http://nwis.waterdata.usgs.gov/usa/nwis/peak).
Types: Map Service,
OGC WFS Layer,
OGC WMS Layer,
OGC WMS Service;
Tags: Boxelder,
Carter County,
Custer County,
Fallon County,
Little Powder,
These data include dissolved silicon concentration and yield from 60 rivers across North America, the Caribbean, and Antarctica from 1964-2021 and are associated with the publication “Long-term change in concentration and yield of riverine dissolved silicon from the poles to the tropics”. Data were compiled from multiple public sources including the Long-term Ecological Research Network, Great Arctic Rivers Observatory, Upper Mississippi River Restoration program, and the U.S. Geological Survey. Concentration and yield estimates were generated by the Weighted Regressions on Time, Discharge and Season model (WRTDS; Hirsch et al. 2010). The dataset includes six files: discrete dissolved silicon data and daily discharge...
Categories: Data;
Tags: Antarctica,
North America,
Puerto Rico,
USGS Science Data Catalog (SDC),
Water Resources,
The U.S. Geological Survey (USGS), in cooperation with the National Marine Sanctuary Program of the National Oceanic and Atmospheric Administration (NOAA), has conducted seabed mapping and related research in the Stellwagen Bank National Marine Sanctuary (SBNMS) region since 1993. The interpretive datasets and source information presented here are for quadrangle 5, which is one of 18 similarly sized segments of the 3,700 square kilometer (km2) SBNMS region. The seabed of the SBNMS region is a glaciated terrain that is topographically and texturally diverse. Quadrangle 5 includes the shallow, rippled, coarse-grained sandy crest and upper eastern and western flanks of southern Stellwagen Bank, its fine-grained sandy...
The U.S. Geological Survey (USGS) has compiled national shoreline data for more than 20 years to document coastal change and serve the needs of research, management, and the public. Maintaining a record of historical shoreline positions is an effective method to monitor national shoreline evolution over time, enabling scientists to identify areas most susceptible to erosion or accretion. These data can help coastal managers and planners understand which areas of the coast are vulnerable to change. This data release includes a compilation of previously published historical shoreline positions for Virginia spanning 148 years (1849-1997), and two new mean high water (MHW) shorelines extracted from lidar data collected...
Categories: Data;
Types: Downloadable,
Map Service,
OGC WFS Layer,
OGC WMS Layer,
Shapefile;
Tags: Atlantic Coast,
Baseline,
DSAS,
Digital Shoreline Analysis System,
Mid-Atlantic,
The U.S. Geological Survey (USGS) has compiled national shoreline data for more than 20 years to document coastal change and serve the needs of research, management, and the public. Maintaining a record of historical shoreline positions is an effective method to monitor national shoreline evolution over time, enabling scientists to identify areas most susceptible to erosion or accretion. These data can help coastal managers and planners understand which areas of the coast are vulnerable to change. This data release includes a compilation of previously published historical shoreline positions for Virginia spanning 148 years (1849-1997), and two new mean high water (MHW) shorelines extracted from lidar data collected...
Categories: Data;
Types: Downloadable,
Map Service,
OGC WFS Layer,
OGC WMS Layer,
Shapefile;
Tags: Atlantic Coast,
Atlantic Coast,
Baseline,
DSAS,
Digital Shoreline Analysis System,
This is an antiquated version of the North American Breeding Bird Survey (BBS) dataset that has been superseded by a more recent release. Unless visitors have a specific need for these archived data, they should return to the Main BBS Dataset Page and choose the most recent data release, as that one will include all BBS data released to date. The 1966-2021 North American Breeding Bird Survey (BBS) dataset contains avian point count data for more than 700 North American bird taxa (species, races, and unidentified species groupings). These data are collected annually during the breeding season, primarily in June, along thousands of randomly established roadside survey routes in the United States and Canada. Routes...
Understanding how sea-level rise will affect coastal landforms and the species and habitats they support is critical for developing approaches that balance the needs of humans and native species. Given the magnitude of the threat posed by sea-level rise, and the urgency to better understand it, there is an increasing need to forecast sea-level rise effects on barrier islands. To address this problem, scientists in the U.S. Geological Survey (USGS) Coastal and Marine Geology program are developing Bayesian networks as a tool to evaluate and to forecast the effects of sea-level rise on shoreline change, barrier island geomorphology, and habitat availability for species such as the piping plover (Charadrius melodus)...
Categories: Data;
Types: Downloadable,
Map Service,
OGC WFS Layer,
OGC WMS Layer,
Shapefile;
Tags: Assateague Island,
Assateague Island,
Assateague Island National Seashore,
Assateague Island National Seashore,
Atlantic Ocean,
The data release details the samples, methods, and raw data used to generate high-quality genome assemblies for greater sage-grouse (Centrocercus urophasianus), white-tailed ptarmigan (Lagopus leucura), and trumpeter swan (Cygnus buccinator). The raw data have been deposited in the Sequence Read Archive (SRA) of the National Center for Biotechnology Information (NCBI), the authoritative repository for public biological sequence data, and are not included in this data release. Instead, the accessions that link to those data via the NCBI portal (www.ncbi.nlm.nih.gov) are provided herein. The release consists of a single file, sample.metadata.txt, which maps NCBI accessions to the samples sequenced and the different...
Sandy ocean beaches are a popular recreational destination, often surrounded by communities containing valuable real estate. Development is on the rise despite the fact that coastal infrastructure is subjected to flooding and erosion. As a result, there is an increased demand for accurate information regarding past and present shoreline changes. To meet these national needs, the Coastal and Marine Geology Program of the U.S. Geological Survey (USGS) is compiling existing reliable historical shoreline data along open-ocean sandy shores of the conterminous United States and parts of Alaska and Hawaii under the National Assessment of Shoreline Change project.There is no widely accepted standard for analyzing shoreline...
Categories: Data;
Types: ArcGIS REST Map Service,
ArcGIS Service Definition,
Downloadable,
Map Service;
Tags: Accretion,
CMGP,
Coastal and Marine Geology Program,
Columbia River,
DSAS,
NOAA’s Deep Sea Coral Research and Technology Program (DSCRTP) is compiling a national database of the locations of deep-sea corals and sponges, beginning in U.S. waters. The DSCRTP will make this information accessible to resource managers, the scientific community, and the public over the World Wide Web. The database fulfills NOAA’s requirements under the Magnuson-Stevens Fishery Conservation and Management Act (MSA) to identify and map locations of deep-sea corals and to submit this information for use by regional fishery management councils. At present, there is no comprehensive, national-scale data portal for deep-sea corals and sponges. Given the authorities outlined in MSA, NOAA’s Deep Sea Coral Research...
Categories: Data;
Types: Citation;
Tags: Arctic Ocean,
Atlantic Ocean,
Caribbean Sea,
Gulf of Mexico,
North America,
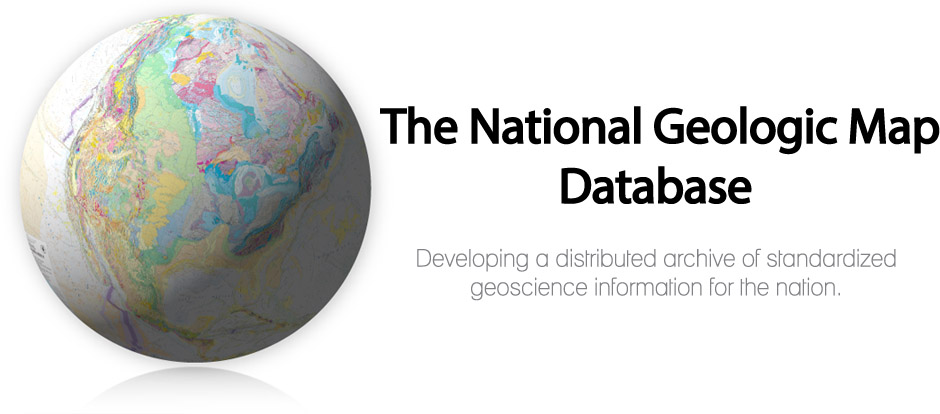
The National Geologic Map Database (NGMDB) is a Congressionally mandated national archive of geoscience maps, reports, and stratigraphic information. The Geologic Mapping Act of 1992 and its Reauthorizations calls for the U.S. Geological Survey and the Association of American State Geologists (AASG) to cooperatively build this national archive, according to technical and scientific standards whose development is coordinated by the NGMDB. The NGMDB consists of a comprehensive set of publication citations, stratigraphic nomenclature, downloadable content in raster and vector formats, unpublished source information, and guidance on standards development. The NGMDB contains information on more than 110,000 maps and...
Ducks and other waterfowl in the U.S. are valued and enjoyed by millions of birdwatchers, artists, photographers and citizens for their beauty and appeal. Waterfowl also provide game for hunters throughout the country and act as an important source of revenue for states and local communities. Loss of habitat and migration corridors due to land use changes and changes in climate threaten these birds, however more scientific information is needed to understand these processes. This project used available annual surveys of duck counts, along with data on the location and availability of ponds and temperature and precipitation patterns, to model where across the continental landscape waterfowl were present and if their...
Categories: Project;
Types: Map Service,
OGC WFS Layer,
OGC WMS Layer,
OGC WMS Service;
Tags: 2011,
Adaptive Harvest Management,
Aerial Survey,
Alaska,
Alaska CASC,
Rangelands have immense inherent spatial and temporal variability, yet assessments of land condition and trends are often assessed relative to the condition of a limited number of representative points. Ecological Potential (EP) data are spatially comprehensive, quantitative, and needed as a baseline for comparison of current rangeland vegetation conditions, trends, and management targets. We define EP as the potential fractional cover of vegetation components bare ground, herbaceous, litter, shrub, and sagebrush represented in the least disturbed and most productive portion of the western U.S. This dataset enables: 1) setting realistic expectations for restoration and management targets at 30-meter resolution,...
The purpose of this field data collection was to test and compare the OceanInsight HDX Mini Spectrometer as an accessible alternative against the more expensive ASD Fieldspec for collecting ground-based hyperspectral reflectance profiles for landcover analysis. The data collection took place in Dog Head Marsh and South Cape Beach within the Waquoit Bay National Estuarine Research Reserve (WBNERR). The hyperspectral profiles were collected side-by-side with both field-spectrometers using comparable sensor collection settings for various ground cover samples. The terrain and vegetation type of these sample were described as well as surveyed using Real Time Kinematic Global Positioning System (RTK-GPS). This data...
Understanding how sea-level rise will affect coastal landforms and the species and habitats they support is critical for developing approaches that balance the needs of humans and native species. Given the magnitude of the threat posed by sea-level rise, and the urgency to better understand it, there is an increasing need to forecast sea-level rise effects on barrier islands. To address this problem, scientists in the U.S. Geological Survey (USGS) Coastal and Marine Geology program are developing Bayesian networks as a tool to evaluate and to forecast the effects of sea-level rise on shoreline change, barrier island geomorphology, and habitat availability for species such as the piping plover (Charadrius melodus)...
Categories: Data;
Types: Downloadable,
Map Service,
OGC WFS Layer,
OGC WMS Layer,
Shapefile;
Tags: Assateague Island,
Assateague Island,
Assateague Island National Seashore,
Assateague Island National Seashore,
Atlantic Ocean,
The dataset accompanies the scientific article, "Reconstructing missing data by comparing interpolation techniques: applications for long-term water quality data." Missingness is typical in large datasets, but intercomparisons of interpolation methods can alleviate data gaps and common problems associated with missing data. We compared seven popular interpolation methods for predicting missing values in a long-term water quality data set from the upper Mississippi River, USA.
Categories: Data;
Tags: Information Sciences,
Mississippi River,
North America,
USGS Science Data Catalog (SDC),
Upper Mississippi River,
|

|
