Filters: Tags: pacific northwest (X)
569 results (36ms)|
Filters
|
This dataset contains information from visual encounter surveys conducted between 2012 and 2016 by USGS as part of an ongoing Oregon spotted frog (Rana pretiosa) monitoring effort in the Oregon Cascade Mountain Range. We surveyed 91 sites using a rotating frame design in the Klamath and Deschutes Basins, Oregon, which encompass most of the species' core extant range. Data consist of spotted frog counts aggregated by date, location, and life stage, as well as data on environmental conditions at the time of each survey.
Categories: Data;
Tags: Aquatic ecology,
Cascade Range,
Deschutes County,
Klamath County,
Lane County,

Pacific-slope Flycatcher station lifetime productivity (STAPI) (log transformed) ranged between -0.034 and +0.606 with a mean value of +0.286 and a median value of +0.247. ________________________________________ Model 1 (3 parameters) Pacific-slope Flycatcher station lifetime productivity (STAPI) (log transformed) was a function of: a) INTERCEPT (0.3022), b) NLCD06AF90P (+0.01874) - percent all forest cover, 90m-resolution(3x aggregation of 30m-resolution), ranged between -1.901 and +6.011 (95% CL) with a mean value of +2.055 and a median value of +2.494, c) NLCD06IM33P (-0.02730) - percent impervious cover, 990m-resolution (33x aggregation of 30m-resolution), ranged between -1.057 and +5.084 (95% CL) with...

Soil residual water corresponds to the model variable "total streamflow." In the model MC1, this is calculated (in cm of water) as the water flowing through the soil profile below the last soil layer (streamflow), water leached into the subsoil (baseflow) and also includes runoff. The output is presented here as a monthly average. Soil residual water is part of the model output from Brendan Rogers' MS thesis work. Brendan used the vegetation model MC1 to simulate vegetation dynamics, associated carbon and nitrogen cycle, water budget and wild fire impacts across the western 2/3 of the states of Oregon and Washington using climate input data from the PRISM group (Chris Daly, OSU) at a 30arc second (800m) spatial...

Soil residual water corresponds to the model variable "total streamflow." In the model MC1, this is calculated (in cm of water) as the water flowing through the soil profile below the last soil layer (streamflow), water leached into the subsoil (baseflow) and also includes runoff. The output is presented here as a monthly average. Soil residual water is part of the model output from Brendan Rogers' MS thesis work. Brendan used the vegetation model MC1 to simulate vegetation dynamics, associated carbon and nitrogen cycle, water budget and wild fire impacts across the western 2/3 of the states of Oregon and Washington using climate input data from the PRISM group (Chris Daly, OSU) at a 30arc second (800m) spatial...

Soil residual water corresponds to the model variable "total streamflow." In the model MC1, this is calculated (in cm of water) as the water flowing through the soil profile below the last soil layer (streamflow), water leached into the subsoil (baseflow) and also includes runoff. The output is presented here as a monthly average. Soil residual water is part of the model output from Brendan Rogers' MS thesis work. Brendan used the vegetation model MC1 to simulate vegetation dynamics, associated carbon and nitrogen cycle, water budget and wild fire impacts across the western 2/3 of the states of Oregon and Washington using climate input data from the PRISM group (Chris Daly, OSU) at a 30arc second (800m) spatial...

Soil residual water corresponds to the model variable "total streamflow." In the model MC1, this is calculated (in cm of water) as the water flowing through the soil profile below the last soil layer (streamflow), water leached into the subsoil (baseflow) and also includes runoff. The output is presented here as a monthly average. Soil residual water is part of the model output from Brendan Rogers' MS thesis work. Brendan used the vegetation model MC1 to simulate vegetation dynamics, associated carbon and nitrogen cycle, water budget and wild fire impacts across the western 2/3 of the states of Oregon and Washington using climate input data from the PRISM group (Chris Daly, OSU) at a 30arc second (800m) spatial...

Soil residual water corresponds to the model variable "total streamflow." In the model Mc1, this is calculated (in cm of water) as the water flowing through the soil profile below the last soil layer (streamflow), Water leached in the subsoil (baseflow) and also includes runoff. the output is prsented here as a monthly average. Soil residual water is part of the model output from Brendan Rogers' MS thesis work. Brendan used the vegetation model MC1 to simulate vegetation dynamics, associated carbon and nitrogen cycle, water budget and wild fire impacts across the western 2/3 of the states of Oregon and Washington using climate input data from the PRISM group (Chris Daly, OSU) at a 30arc second (800m) spatial grain....

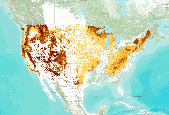
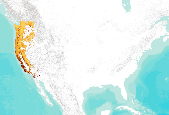
The dataset contains 3 maps that show the current and predicted range of Engelmann spruce (Picea engelmannii) in the Pacific Northwest region. The layers include: 1) the species range modeled under current climate conditions for 1950-75 2) a continuous model of the predicted range for 1950-2006 and 3) potential range expansion and contraction from 2000-2009.

For a description of each map layer, select the Details tab, then select a Layer Name. This GIS dataset is part of a suite of wildlife habitat connectivity data produced by the Washington Wildlife Habitat Connectivity Working Group (WHCWG). The WHCWG is a voluntary public-private partnership between state and federal agencies, universities, tribes, and non-governmental organizations. The WHCWG is co-led by the Washington Department of Fish and Wildlife (WDFW) and the Washington Department of Transportation (WSDOT). This dataset quantifies current wildlife habitat connectivity patterns for the Columbia Plateau Ecoregion in Washington, Oregon, and Idaho. Available WHCWG raster data include model base layers, resistance,...

Nashville Warbler - VizBand/Land AIC Model Selection Created: 17-May-2011 Nashville Warbler annual capture rate of adult (ADULT) individuals (log transformed) ranged between -0.233 and +2.357 with a mean value of +1.062 and a median value of +1.045. ________________________________________ Model 1 (3 parameters) Nashville Warbler annual capture rate of adult (ADULT) individuals (log transformed) was a function of: a) NLCD06CO2KP (-0.03933) - percent coniferous forest cover, 990m-resolution in a landscape context of 2km radius, ranged between +9.653 and +23.455 (95% CL) with a mean value of +16.554 and a median value of +18.030, b) STRMNET5K (+0.04352) - stream density (percent of pixels), 990m-resolution in a landscape...

For a description of each map layer, select the Details tab, then select a Layer Name. This GIS dataset is part of a suite of wildlife habitat connectivity data produced by the Washington Wildlife Habitat Connectivity Working Group (WHCWG). The WHCWG is a voluntary public-private partnership between state and federal agencies, universities, tribes, and non-governmental organizations. The WHCWG is co-led by the Washington Department of Fish and Wildlife (WDFW) and the Washington Department of Transportation (WSDOT). This dataset quantifies current wildlife habitat connectivity patterns for the Columbia Plateau Ecoregion in Washington, Oregon, and Idaho. Available WHCWG raster data include model base layers, resistance,...
For a description of each map layer, select the Details tab, then select a Layer Name. This GIS dataset is part of a suite of wildlife habitat connectivity data produced by the Washington Wildlife Habitat Connectivity Working Group (WHCWG). The WHCWG is a voluntary public-private partnership between state and federal agencies, universities, tribes, and non-governmental organizations. The WHCWG is co-led by the Washington Department of Fish and Wildlife (WDFW) and the Washington Department of Transportation (WSDOT). This dataset quantifies current wildlife habitat connectivity patterns for the Columbia Plateau Ecoregion in Washington, Oregon, and Idaho. Available WHCWG raster data include model base layers, resistance,...
Hermit Warbler - VizBand/Land AIC Model Selection Created: 12-Aug-2011 Hermit Warbler annual capture rate of adult (ADULT) individuals (log transformed) ranged between -0.281 and +2.243 with a mean value of +0.981 and a median value of +0.875. ________________________________________ Model 1 (3 parameters) Hermit Warbler annual capture rate of adult (ADULT) individuals (log transformed) was a function of: a) GTOPO30_AL (+0.20641) - elevation (m), ranged between +5.119 and +8.376 (95% CL) with a mean value of +6.747 and a median value of +7.137, b) NLCD06AG5KP (-0.19572) - percent agricultural/grassland cover, 990m-resolution in a landscape context of 5km radius, ranged between -0.657 and +2.530 (95% CL) with a mean...
Introduction : Swainson’s Thrush is a medium sized (15-18cm) thrush which prefers to breed in dense shrub growth associated with spruce-fir forests. The "russet-backed" race prefers mixed forests and deciduous riparian woodlands of the coastal region from British Columbia, to northern California. These Pacific populations winter in mature tropical and secondary forests of Central America, whereas the "olive-backed" race that breeds in the Boreal and Rockies winters in S. America. Models of Monitoring Avian Productivity and Survival (MAPS) demographic data and high-resolution land cover data showed that Swainson’s Thrush prefers large intact forest patches with low perimeter to area ratios. On a regional...
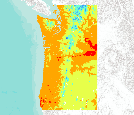
For his MS thesis, Brendan Rogers used climate data from the PRISM group (Chris Daly, Oregon State University) at a 30arc second (800m) spatial grain across the western 2/3 of the states of Oregon and Washington to generate a climatology or baseline. He then created future climate change scenarios using statistical downscaling to create anomalies from three General Circulation Models (CSIRO Mk3, MIROC 3.2 medres, and Hadley CM 3), each run through three CO2 emission scenarios (SRES B1, A1B, and A2).

For his MS thesis, Brendan Rogers used climate data from the PRISM group (Chris Daly, Oregon State University) at a 30arc second (800m) spatial grain across the western 2/3 of the states of Oregon and Washington to generate a climatology or baseline. He then created future climate change scenarios using statistical downscaling to create anomalies from three General Circulation Models (CSIRO Mk3, MIROC 3.2 medres, and Hadley CM 3), each run through three CO2 emission scenarios (SRES B1, A1B, and A2).

For his MS thesis, Brendan Rogers used climate data from the PRISM group (Chris Daly, Oregon State University) at a 30arc second (800m) spatial grain across the western 2/3 of the states of Oregon and Washington to generate a climatology or baseline. He then created future climate change scenarios using statistical downscaling to create anomalies from three General Circulation Models (CSIRO Mk3, MIROC 3.2 medres, and Hadley CM 3), each run through three CO2 emission scenarios (SRES B1, A1B, and A2).

The dataset contains 3 maps that show the current and predicted range of Pacific Silver Fir (Abies amabilis) in the Pacific Northwest region. The layers include: 1) the species range modeled under current climate conditions for 1950-75 2) a continuous model of the predicted range for 1950-2006 and 3) potential range expansion and contraction from 2000-2009.
These data were compiled for a manuscript in which 1) we develop a water temperature model for the major river segments and tributaries of the Colorado River basin, including the Colorado, Green, Yampa, White, and San Juan rivers; 2) we link modeled water temperature to fish population data to predict the probability native and nonnative species will be common in the future in a warming climate; and 3) assess the degree to which dams create thermal discontinuity in summer in river segments across the western US. Per goal #1, we developed a water temperature model using data spanning 1985-2015 that predicts water temperature every 1 mile (1.6-km) in rivers both now and in the future due to the potential influence...
Land management practices often directly alter vegetation structure and composition, but the degree to which ecological processes such as herbivory interact with management to influence biodiversity is less well understood. We hypothesized that intensive forest management and large herbivores have compounding effects on early-seral plant communities and plantation establishment (i.e., tree survival and growth), and the degree of such effects is dependent on the intensity of management practices. We established 225 m2 wild ungulate (deer and elk) exclosures nested within a manipulated gradient of management intensity (no-spray Control, Light herbicide, Moderate herbicide and Intensive herbicide treatments), replicated...
Categories: Data;
Types: Citation;
Tags: Lincoln County, Oregon,
Oregon,
Oregon Coast Range,
Pacific Northwest,
Polk County, Oregon,
|

|
