Filters: Tags: ph (X)
114 results (31ms)|
Filters
Date Range
Extensions Types Contacts
Categories Tag Types
|
This data set depicts soil characteristics in western North America. The data set was created from NRCS STATSGO soil data. Calculations were made to reduce one to many relationships to one to one relationships in order to summarize average water capacity, depth to rock, salinity, and pH for each map unit (MUID). ArcMap 8.3 was used to import .dbf files and merge newly created attribute fields to the GIS soil coverage.
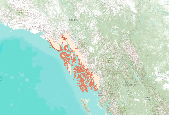
This dataset represents the soil pH from SSURGO and STATSGO soil descriptions for soil map units in the state of southern Alaska that lie within the North Pacific Landscape Conservation Cooperative.

This dataset represents the soil pH from SSURGO and STATSGO soil descriptions for soil map units in the state of western Washington that lie within the North Pacific Landscape Conservation Cooperative.

This dataset covers the southern half of the Southern Rockies Landscape Conservation Cooperative. It was aggregated and converted to raster by Conservation Biology Institute as part of a soil vulnerability study funded in part by the Southern Rockies LCC. The soil data come from a digital soil survey, the most detailed level of soil geographic data developed by the National Cooperative Soil Survey. The information was prepared by digitizing maps, by compiling information onto a planimetric correct base and digitizing, or by revising digitized maps using remotely sensed and other information. This data set consists of georeferenced digital map data and computerized attribute data. The map data are in a soil survey...
Winter climate change has the potential to have a large impact on coastal wetlands in the southeastern U.S. Warmer winter temperatures and reductions in the intensity of freeze events would likely lead to mangrove forest range expansion and salt marsh displacement in parts of the U.S. Gulf of Mexico and Atlantic coast. The objective of this research was to better understand some of the ecological implications of mangrove forest migration and salt marsh displacement. The potential ecological effects of mangrove migration are diverse ranging from important biotic impacts (e.g., coastal fisheries, land bird migration; colonial nesting wading birds) to ecosystem stability (e.g., response to sea level rise and drought;...
These data were released prior to the October 1, 2016 effective date for the USGS’s policy dictating the review, approval, and release of scientific data as referenced in USGS Survey Manual Chapter 502.8 Fundamental Science Practices: Review and Approval of Scientific Data for Release. This map shows specific water-quality items and hydrologic data site information which come from QWDATA (Water Quality) and GWSI (Ground Water Information System). Both QWDATA and GWSI are subsystems of NWIS (National Water Inventory System)of the USGS (United States Geologic Survey). This map is for Uintah County, Utah. The scope and purpose of NWIS is defined on the web site: http://water.usgs.gov/public/pubs/FS/FS-027-98/
These data were released prior to the October 1, 2016 effective date for the USGS’s policy dictating the review, approval, and release of scientific data as referenced in USGS Survey Manual Chapter 502.8 Fundamental Science Practices: Review and Approval of Scientific Data for Release. This map shows specific water-quality items and hydrologic data site information which come from QWDATA (Water Quality) and GWSI (Ground Water Information System). Both QWDATA and GWSI are subsystems of NWIS (National Water Inventory System)of the USGS (United States Geologic Survey). This map is for Daggett County, Utah. The scope and purpose of NWIS is defined on the web site: http://water.usgs.gov/public/pubs/FS/FS-027-98/
Interest in the field of environmental DNA (eDNA) is growing rapidly and eDNA surveys are becoming an important consideration for aquatic resource managers dealing with invasive species. However, in order for eDNA monitoring to mature as a research and management tool, there are several critical knowledge gaps that must be filled. One such gap is the fate of eDNA materials in the aquatic environment. Understanding the environmental factors that influence the decay of eDNA and how these factors impact detection probabilities over time and space could have significant implications for eDNA survey design and data interpretation. Here we experimentally explore eDNA decay in waste materials and reproductive cells obtained...
Categories: Data;
Types: Citation;
Tags: Aquatic Biology,
Ecology,
Environmental Health,
Genetics,
Missouri,
Water velocities and water-quality constituents were measured along planned survey lines, which were generally perpendicular to the shoreline and spaced 100 meters apart, over an approximately 2.3-mile section of nearshore Lake Erie on June 10-12, 2019 (survey 1), and August 19-21, 2019 (survey 2), using a 1200 kHz acoustic Doppler current profiler (ADCP), a YSI 6920 V2 multiparameter sonde, and a YSI EcoMapper autonomous underwater vehicle (AUV). Water-quality data collected in this area included near-surface and three-dimensional measurements of water temperature, specific conductance, pH, dissolved oxygen, turbidity, chlorophyll, and phycocyanin (blue-green algae). The data were geo-referenced with an integrated...
Categories: Data;
Tags: Cleveland,
Easterly Wastewater Treatment Plant (WWTP),
EcoMapper,
Euclid Creek,
Lake Erie,
This U.S. Geological Survey (USGS) Data Release provides spatial water-quality data collected from Milford Lake, Kansas, on May 26, June 9, July 14, July 21, and September 15, 2016. All data are reported as raw measured values and are not rounded to USGS significant figures. Continuous water-quality monitors were used to measure water temperature, specific conductance, turbidity, pH, chlorophyll, phycocyanin, dissolved oxygen, and fluorescent dissolved organic matter (fDOM) at thirty-second intervals at depths of 0.5- and 1.5-meters throughout the lake.
Categories: Data;
Tags: Chlorophyll,
Continuously Measured,
Dissolved Oxygen,
Field Deployment,
Fluorescent Dissolved Organic Matter (fDOM),
This U.S. Geological Survey (USGS) data release provides water-quality data collected from the Caloosahatchee River and 12 fiberglass tanks located within the Caloosahatchee River. The tanks were open to the atmosphere, and were closed to the river. Tanks were filled with native water within 1-2 hours prior to the first profile collected on May 6, July 8, and September 16. Nutrients were added at approximately 12:00 p.m. on May 6, 11:45 a.m. on July 8, and 11:00 a.m. on September 16. Sodium nitrate was added for the nitrate treatments, sodium phosphate was added for the phosphate treatments, and ammonium hydroxide was added for the ammonium treatments. Nutrient samples were collected and processed by Nova Southeastern...
Categories: Data;
Tags: Caloosahatchee River,
USGS Science Data Catalog (SDC),
Water Quality,
chlorophyll,
dissolved oxygen,
Soil pH measures acidity, which affects nutrient uptake by plants. The most common soil laboratory measurement of pH is the 1:1 water method. A crushed soil sample is mixed with an equal amount of water, and a measurement is made of the suspension. For each soil layer, this attribute is actually recorded as three separate values in the database. A low value and a high value indicate the range of this attribute for the soil component. A "representative" value indicates the expected value of this attribute for the component. For this soil property, only the representative value is used. A weighted average aggregation method was used to aggregate soil components within a 0-30 cm depth range.The dataset was derived...
Categories: Data;
Types: ArcGIS REST Map Service,
ArcGIS Service Definition,
Downloadable,
Map Service;
Tags: DSL,
Data,
LCC Network Science Catalog,
North Atlantic Landscape Conservation Cooperative Data.gov,
Soil,
These data were released prior to the October 1, 2016 effective date for the USGS’s policy dictating the review, approval, and release of scientific data as referenced in USGS Survey Manual Chapter 502.8 Fundamental Science Practices: Review and Approval of Scientific Data for Release. This map shows specific water-quality items and hydrologic data site information which come from QWDATA (Water Quality) and GWSI (Ground Water Information System). Both QWDATA and GWSI are subsystems of NWIS (National Water Inventory System)of the USGS (United States Geologic Survey). This map is for Davis County, Utah. The scope and purpose of NWIS is defined on the web site: http://water.usgs.gov/public/pubs/FS/FS-027-98/
These data were released prior to the October 1, 2016 effective date for the USGS’s policy dictating the review, approval, and release of scientific data as referenced in USGS Survey Manual Chapter 502.8 Fundamental Science Practices: Review and Approval of Scientific Data for Release. This map shows specific water-quality items and hydrologic data site information which come from QWDATA (Water Quality) and GWSI (Ground Water Information System). Both QWDATA and GWSI are subsystems of NWIS (National Water Inventory System)of the USGS (United States Geologic Survey). This map is for Grand County, Utah. The scope and purpose of NWIS is defined on the web site: http://water.usgs.gov/public/pubs/FS/FS-027-98/
These data were released prior to the October 1, 2016 effective date for the USGS’s policy dictating the review, approval, and release of scientific data as referenced in USGS Survey Manual Chapter 502.8 Fundamental Science Practices: Review and Approval of Scientific Data for Release. This map shows specific water-quality items and hydrologic data site information which come from QWDATA (Water Quality) and GWSI (Ground Water Information System). Both QWDATA and GWSI are subsystems of NWIS (National Water Inventory System)of the USGS (United States Geologic Survey). This map is for Tooele County, Utah. The scope and purpose of NWIS is defined on the web site: http://water.usgs.gov/public/pubs/FS/FS-027-98/
“Under section 303(d) of the 1972 Clean Water Act, states, territories, and authorized tribes are required to develop lists of impaired waters. These impaired waters do not meet water quality standards that states, territories, and authorized tribes have set for them, even after point sources of pollution have installed the minimum required levels of pollution control technology. The law requires that these jurisdictions establish priority rankings for waters on the lists and develop TMDLs for these waters” (U.S. Environmental Protection Agency, 2011). Waterways represented in this data set are a subset of these EPA 303 (d) listed streams that were classified as nutrient impaired. Nutrient impaired streams include...
This tabular data set represents the soil pH as processed from STATSGO2 database compiled for two spatial components of the NHDPlus version 2 data suite (NHDPlusv2) for the conterminous United States; 1) individual reach catchments and 2) reach catchments accumulated upstream through the river network. The source data was produced by the United States Geological Survey (Wieczorek, 2019). Soil pH units are approximately the negative of the base 10 logarithm of the molar concentration, measured in units of moles per liter, of hydrogen ions. This dataset can be linked to the NHDPlus version 2 data suite by the unique identifier COMID. Reach catchment information characterizes data at the local scale. Reach catchments...
This dataset is comprised of water quality data and benthic macroinvertebrate data collected from basins in Colorado, USA, and Finland. The data includes ancillary water quality characteristics but also a suite of trace metals observed at each site. Also included are modeled outputs that characterize the bioavailability of each trace metal to a biotic ligand. These data were used to explore the importance of metal toxicity and pH as stressors on benthic macroinvertebrates characterized as the number of unique Ephemeroptera + Plecoptera + Trichoptera genera observed at each site. An interpretive summary of the work follows. One of the primary goals of biological assessment of rivers is to identify whether contaminants...
Categories: Data;
Types: Citation,
Map Service,
OGC WFS Layer,
OGC WMS Layer,
OGC WMS Service;
Tags: Benthic Macroinvertebrates,
Bioavailability,
Colorado,
Europe,
Finland,

This dataset covers the northern half of the Southern Rockies Landscape Conservation Cooperative. It was aggregated and converted to raster by Conservation Biology Institute as part of a soil vulnerability study funded in part by the Southern Rockies LCC. The soil data come from a digital soil survey, the most detailed level of soil geographic data developed by the National Cooperative Soil Survey. The information was prepared by digitizing maps, by compiling information onto a planimetric correct base and digitizing, or by revising digitized maps using remotely sensed and other information. This data set consists of georeferenced digital map data and computerized attribute data. The map data are in a soil survey...
Velocity and water-quality surveys were completed along an approximately 71-mile reach of the Ohio River between Markland Locks and Dam (river mile 531.5) and McAlpine Locks and Dam (river mile 606.8) on October 27–November 4, 2016 (survey #1), and June 26–29, 2017 (survey #2). Water-quality data collected in this reach included surface measurements and vertical profiles of water temperature, specific conductance, pH, dissolved oxygen, turbidity, chlorophyll, and phycocyanin. Streamflow and velocity data were collected simultaneous to the water-quality data at cross-sections and along longitudinal lines (corresponding to the water-quality surface measurements) and at selected stationary locations (corresponding...
Categories: Data;
Tags: Indiana,
Kentucky,
Louisville,
Markland Locks and Dam,
McAlpine Locks and Dam,
|

|
