Filters: Tags: precip (X)
18 results (72ms)|
Filters
Date Range
Extensions Types
Contacts
Categories Tag Types Tag Schemes |

Mean Annual Precipitation under the A2 Emissions Scenario (Western North America, 23 AOGCM Ensemble)
This set of 4 rasters shows mean annual precipitation (mm) for Western North America under the A2 Emissions Scenario from the Intergovernmental Panel on Climate Change (IPCC). One layer shows the historic period (1961 to 1990), and there are three layers of future climate projections representing the 2020s, the 2050s, and the 2080s. These future layers are ensemble averages across all 23 CMIP3 AOGCMs (Coupled Model Intercomparison Project 3 Atmosphere-Ocean General Circulation Models). All layers have a resolution of 1 km, and are designed to capture climate gradients, temperature inversions, and rain shadows in the mountainous landscape of western North America.

This set of 4 rasters shows mean summer (May to Sep) precipitation (mm) for Western North America under the B1 Emissions Scenario from the Intergovernmental Panel on Climate Change (IPCC). One layer shows the historic period (1961 to 1990), and there are three layers of future climate projections representing the 2020s, the 2050s, and the 2080s. These future layers are ensemble averages across all 23 CMIP3 AOGCMs (Coupled Model Intercomparison Project 3 Atmosphere-Ocean General Circulation Models). All layers have a resolution of 1 km, and are designed to capture climate gradients, temperature inversions, and rain shadows in the mountainous landscape of western North America.
These data are estimates of average annual precipitation, in inches, for the climatological period 1971-2000. Parameter-elevation Regressions on Independent Slopes Model (PRISM) derived raster data is the underlying data set from which the data were created. PRISM is an analytical model that uses point data and a digital elevation model (DEM) to generate gridded estimates of annual, monthly and event-based climatic parameters. For further information, the online PRISM homepage can be found at http://www.ocs.orst.edu/prism/. The data is available as an ESRI GridASCII export file, in latitude/longitude coordinates with a horizontal resolution of 0.00833 degrees, for the entire United States from the Oregon Climate...
Categories: Data;
Types: Downloadable,
Map Service,
OGC WFS Layer,
OGC WMS Layer,
Shapefile;
Tags: Climate,
MT,
Montana,
Precip,
precipitation

This set of 4 rasters shows mean annual precipitation (mm) for Western North America under the A1B Emissions Scenario from the Intergovernmental Panel on Climate Change (IPCC). One layer shows the historic period (1961 to 1990), and there are three layers of future climate projections representing the 2020s, the 2050s, and the 2080s. These future layers are ensemble averages across all 23 CMIP3 AOGCMs (Coupled Model Intercomparison Project 3 Atmosphere-Ocean General Circulation Models). All layers have a resolution of 1 km, and are designed to capture climate gradients, temperature inversions, and rain shadows in the mountainous landscape of western North America.

This set of 4 rasters shows summer (Jun to Aug) precipitation (mm) for Western North America under the A1B Emissions Scenario from the Intergovernmental Panel on Climate Change (IPCC). One layer shows the historic period (1961 to 1990), and there are three layers of future climate projections representing the 2020s, the 2050s, and the 2080s. These future layers are ensemble averages across all 23 CMIP3 AOGCMs (Coupled Model Intercomparison Project 3 Atmosphere-Ocean General Circulation Models). All layers have a resolution of 1 km, and are designed to capture climate gradients, temperature inversions, and rain shadows in the mountainous landscape of western North America.

This set of 4 rasters shows winter (Dec to Feb) precipitation (mm) for Western North America under the A1B Emissions Scenario from the Intergovernmental Panel on Climate Change (IPCC). One layer shows the historic period (1961 to 1990), and there are three layers of future climate projections representing the 2020s, the 2050s, and the 2080s. These future layers are ensemble averages across all 23 CMIP3 AOGCMs (Coupled Model Intercomparison Project 3 Atmosphere-Ocean General Circulation Models). All layers have a resolution of 1 km, and are designed to capture climate gradients, temperature inversions, and rain shadows in the mountainous landscape of western North America.

This set of 4 rasters shows summer (Jun to Aug) precipitation (mm) for Western North America under the A2 Emissions Scenario from the Intergovernmental Panel on Climate Change (IPCC). One layer shows the historic period (1961 to 1990), and there are three layers of future climate projections representing the 2020s, the 2050s, and the 2080s. These future layers are ensemble averages across all 23 CMIP3 AOGCMs (Coupled Model Intercomparison Project 3 Atmosphere-Ocean General Circulation Models). All layers have a resolution of 1 km, and are designed to capture climate gradients, temperature inversions, and rain shadows in the mountainous landscape of western North America.
This set of 4 rasters shows mean annual precipitation (mm) for Western North America under the A1B Emissions Scenario from the Intergovernmental Panel on Climate Change (IPCC). One layer shows the historic period (1961 to 1990), and there are three layers of future climate projections representing the 2020s, the 2050s, and the 2080s. These future layers are ensemble averages across all 23 CMIP3 AOGCMs (Coupled Model Intercomparison Project 3 Atmosphere-Ocean General Circulation Models). All layers have a resolution of 1 km, and are designed to capture climate gradients, temperature inversions, and rain shadows in the mountainous landscape of western North America. These data, originally published here, were converted...
Categories: Data;
Types: ArcGIS REST Map Service,
ArcGIS Service Definition,
Downloadable,
Map Service;
Tags: 2020s,
2050s,
2080s,
A1B,
ClimateWNA,

This set of 4 rasters shows mean summer (May to Sep) precipitation (mm) for Western North America under the A2 Emissions Scenario from the Intergovernmental Panel on Climate Change (IPCC). One layer shows the historic period (1961 to 1990), and there are three layers of future climate projections representing the 2020s, the 2050s, and the 2080s. These future layers are ensemble averages across all 23 CMIP3 AOGCMs (Coupled Model Intercomparison Project 3 Atmosphere-Ocean General Circulation Models). All layers have a resolution of 1 km, and are designed to capture climate gradients, temperature inversions, and rain shadows in the mountainous landscape of western North America.
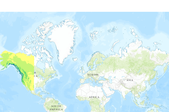
ClimateWNA: A program to generate high-resolution climate data for climate change studies and applications in western North America Overview ClimateWNA extracts and downscales PRISM (Daly et al. 2002) monthly data (2.5 x 2.5 arcmin) for the reference period (1961-1990), and calculates seasonal and annual climate variables for specific locations based on latitude, longitude and elevation (optional) for western North America, shown in the map on the right. This program also downscales and integrates historical (1901-2011) (Mitchell and Jones 2005 for 1901-2009) and future climate data (2020s, 2050s and 2080s) generated by various global circulation models. The output includes both directly calculated and derived...
This data set represents isohyetals and precipitation zones in the Big Horn Basin.
Categories: Data;
Types: Downloadable;
Tags: BLM,
Casper Field Office,
Cody Field Office,
Precip,
Wyoming,
This set of 4 rasters shows winter (Dec to Feb) precipitation (mm) for Western North America under the B1 Emissions Scenario from the Intergovernmental Panel on Climate Change (IPCC). One layer shows the historic period (1961 to 1990), and there are three layers of future climate projections representing the 2020s, the 2050s, and the 2080s. These future layers are ensemble averages across all 23 CMIP3 AOGCMs (Coupled Model Intercomparison Project 3 Atmosphere-Ocean General Circulation Models). All layers have a resolution of 1 km, and are designed to capture climate gradients, temperature inversions, and rain shadows in the mountainous landscape of western North America.

This set of 4 rasters shows winter (Dec to Feb) precipitation (mm) for Western North America under the A2 Emissions Scenario from the Intergovernmental Panel on Climate Change (IPCC). One layer shows the historic period (1961 to 1990), and there are three layers of future climate projections representing the 2020s, the 2050s, and the 2080s. These future layers are ensemble averages across all 23 CMIP3 AOGCMs (Coupled Model Intercomparison Project 3 Atmosphere-Ocean General Circulation Models). All layers have a resolution of 1 km, and are designed to capture climate gradients, temperature inversions, and rain shadows in the mountainous landscape of western North America.
Mean Annual Precipitation under the B1 Emissions Scenario (Western North America, 23 AOGCM Ensemble)
This set of 4 rasters shows mean annual precipitation (mm) for Western North America under the B1 Emissions Scenario from the Intergovernmental Panel on Climate Change (IPCC). One layer shows the historic period (1961 to 1990), and there are three layers of future climate projections representing the 2020s, the 2050s, and the 2080s. These future layers are ensemble averages across all 23 CMIP3 AOGCMs (Coupled Model Intercomparison Project 3 Atmosphere-Ocean General Circulation Models). All layers have a resolution of 1 km, and are designed to capture climate gradients, temperature inversions, and rain shadows in the mountainous landscape of western North America. These data, originally published here, were converted...
Categories: Data;
Types: ArcGIS REST Map Service,
ArcGIS Service Definition,
Downloadable,
Map Service;
Tags: 2020s,
2050s,
2080s,
B1,
ClimateWNA,
Mean Annual Precipitation under the A2 Emissions Scenario (Western North America, 23 AOGCM Ensemble)
This set of 4 rasters shows mean annual precipitation (mm) for Western North America under the A2 Emissions Scenario from the Intergovernmental Panel on Climate Change (IPCC). One layer shows the historic period (1961 to 1990), and there are three layers of future climate projections representing the 2020s, the 2050s, and the 2080s. These future layers are ensemble averages across all 23 CMIP3 AOGCMs (Coupled Model Intercomparison Project 3 Atmosphere-Ocean General Circulation Models). All layers have a resolution of 1 km, and are designed to capture climate gradients, temperature inversions, and rain shadows in the mountainous landscape of western North America. These data, originally published here, were converted...
Categories: Data;
Types: ArcGIS REST Map Service,
ArcGIS Service Definition,
Downloadable,
Map Service;
Tags: 2020s,
2050s,
2080s,
A2,
ClimateWNA,

Mean Annual Precipitation under the B1 Emissions Scenario (Western North America, 23 AOGCM Ensemble)
This set of 4 rasters shows mean annual precipitation (mm) for Western North America under the B1 Emissions Scenario from the Intergovernmental Panel on Climate Change (IPCC). One layer shows the historic period (1961 to 1990), and there are three layers of future climate projections representing the 2020s, the 2050s, and the 2080s. These future layers are ensemble averages across all 23 CMIP3 AOGCMs (Coupled Model Intercomparison Project 3 Atmosphere-Ocean General Circulation Models). All layers have a resolution of 1 km, and are designed to capture climate gradients, temperature inversions, and rain shadows in the mountainous landscape of western North America.

This set of 4 rasters shows mean summer (May to Sep) precipitation (mm) for Western North America under the A1B Emissions Scenario from the Intergovernmental Panel on Climate Change (IPCC). One layer shows the historic period (1961 to 1990), and there are three layers of future climate projections representing the 2020s, the 2050s, and the 2080s. These future layers are ensemble averages across all 23 CMIP3 AOGCMs (Coupled Model Intercomparison Project 3 Atmosphere-Ocean General Circulation Models). All layers have a resolution of 1 km, and are designed to capture climate gradients, temperature inversions, and rain shadows in the mountainous landscape of western North America.

This set of 4 rasters shows winter (Dec to Feb) precipitation (mm) for Western North America under the A1B Emissions Scenario from the Intergovernmental Panel on Climate Change (IPCC). One layer shows the historic period (1961 to 1990), and there are three layers of future climate projections representing the 2020s, the 2050s, and the 2080s. These future layers are ensemble averages across all 23 CMIP3 AOGCMs (Coupled Model Intercomparison Project 3 Atmosphere-Ocean General Circulation Models). All layers have a resolution of 1 km, and are designed to capture climate gradients, temperature inversions, and rain shadows in the mountainous landscape of western North America.
|

|
