Filters: Tags: river (X) > partyWithName: U.S. Geological Survey (X)
67 results (26ms)|
Filters
Date Range
Extensions
Types Contacts
Categories Tag Types
|
Field spikes were prepared at 207 stream and river sites as part of the U.S. Geological Survey (USGS) National Water Quality Assessment (NAWQA) project between December, 2012, and September, 2015. At the field site, a depth-and width-integrated environmental sample was collected, and one subsample of the environmental sample was spiked with a known amount of a spike mixture. Both the spiked subsample ("spike sample") and another subsample ("environmental sample") of the original water sample were analyzed for pesticides at the USGS National Water Quality Laboratory (NWQL) by direct injection liquid chromatography with tandem mass spectrometry (LC-MS/MS), and were used to calculate the spike recovery of each analyte....
Water surface elevations within seven Willamette River off-channel features (OCF; alcoves and side channels) were measured using submerged pressure transducers. Transducers were installed from late May through mid-October, 2016, when discharge of the Willamette River was between approximately 5,500 and 45,000 cubic feet per second at Salem, Oregon (USGS gage 14191000) and 3,500 to 17,500 cubic feet per second at Harrisburg, Oregon (USGS gage 14166000). Pressure transducer sensor depth was measured at all seven sites. For five of the sites, pressure transducer sensor depths were converted to water surface elevations by surveying the water surface at each transducer with a real-time kinematic global positioning system...
Categories: Data;
Types: Citation,
Map Service,
OGC WFS Layer,
OGC WMS Layer,
OGC WMS Service;
Tags: Ecology,
Geomorphology,
Oregon,
RTK,
USGS Science Data Catalog (SDC),
Water-surface elevation measurements were collected in Spring, 2015 along the upper Willamette River, Oregon, between Harrisburg and Corvallis. These surveys were collected over a small range of discharges, from 6,900 cubic feet per second to 8,300 cubic feet per second, using a real-time kinematic global positioning system (RTK-GPS) on a motorboat at various cross sections along the river. These datasets were collected for equipment calibration and validation for the National Aeronautics and Space Administration’s (NASA) Surface Water and Ocean Topography (SWOT) satellite mission. This is one of multiple survey datasets that will be released for this effort.
This dataset contains all the layers associated with U.S. Geological Survey (USGS) Great Lakes Coastal Wetland Restoration Assessment (GLCWRA) initiative for the Upper Peninsula Restoration Assessment (UPRA) which aims to identify and rank coastal areas with the greatest potential for wetland habitat restoration. Each layer has a unique contribution to the identification of restorable wetlands. The 7 parameters (Parameter 0: Mask, Parameter 1: Hydroperiod, Parameter 2: Wetland Soils, Parameter 3: Flowlines, Parameter 4: Conservation and Recreation Lands, Parameter 5: Impervious Surfaces, and Parameter 6: Land Use) and Index Composite directly correlate to areas that are recommended for restoration. The dikes, degree...
Categories: Data Release - Revised;
Types: GeoTIFF,
Map Service,
OGC WFS Layer,
OGC WMS Layer,
OGC WMS Service;
Tags: Chippewa,
Great Lakes,
Holocene,
Lake Huron,
Lake Michigan,
Digital flood-inundation maps for a 9.3-mile reach of the Iowa River along the Meskwaki Settlement, Iowa, were created by the U.S. Geological Survey (USGS) in cooperation with the Sac and Fox Tribe of the Mississippi River in Iowa. The flood-inundation maps, which can be accessed through the USGS Flood Inundation Mapping Science web site at https://water.usgs.gov/osw/flood_inundation/ depict estimates of the areal extent and depth of flooding corresponding to selected water levels (stages) at the USGS streamgage 05451770 on the Iowa River at County Highway E49 near Tama, Iowa. Near-real-time stages at this streamgage may be obtained on the internet from the USGS National Water Information System at https://waterdata.usgs.gov/...
Categories: Data;
Types: Downloadable,
GeoTIFF,
Map Service,
Raster;
Tags: Iowa,
Iowa River,
Meskwaki Settlement,
biota,
flood,
Continuous water temperature data were collected at multiple sites along the Middle Fork and mainstem Willamette Rivers between Jasper and Newberg, Oregon, to support effectiveness monitoring for a large-scale channel and floodplain restoration program (Willamette Focused Investment Partnership, WFIP). Continuous water temperature loggers were deployed at a subset of WFIP restoration sites where river restoration activities were implemented to improve habitat conditions for native fish species. Data from water temperature monitoring will be used to evaluate the effectiveness of restoration activities at improving habitat conditions for Endangered Species Act (ESA)-listed salmonids and other native fish in the Willamette...
Categories: Data;
Tags: Albany,
Bowers Rock State Park,
Browns Island,
Collins Bay,
Middle Fork Willamette River,
These data were used to examine drivers behind changes in water temperature downriver of dams across the western U.S. from 1995-2015 and the influence of such changes on rainbow trout recruitment and rainbow and brown trout adult length. First, we linked reservoir storage capacity and dam size to the warmest monthly water temperature per water year (WY) to assess the influence of low storage capacity (shallow reservoirs) on downstream water temperature. We then took results from previously published Generalized Linear Mixed Models (GLMM) that assessed the influence of physical and biological predictors (e.g., flow, trout density, reservoir metrics) on trout recruitment and adult size and added mean annual, maximum...
Digital flood-inundation maps for a 7.5-mile reach of the White River at Noblesville, Indiana, were created by the U.S. Geological Survey (USGS) in cooperation with the Indiana Department of Transportation. The flood-inundation maps, which can be accessed through the USGS Flood Inundation Mapping Science website at https://water.usgs.gov/osw/flood_inundation/, depict estimates of the areal extent and depth of flooding corresponding to selected water levels (stages) at the White River at Noblesville, Ind., streamgage (USGS station number 03349000). Real-time stages at this streamgage may be obtained from the USGS National Water Information System at https://waterdata.usgs.gov/nwis or the National Weather Service...
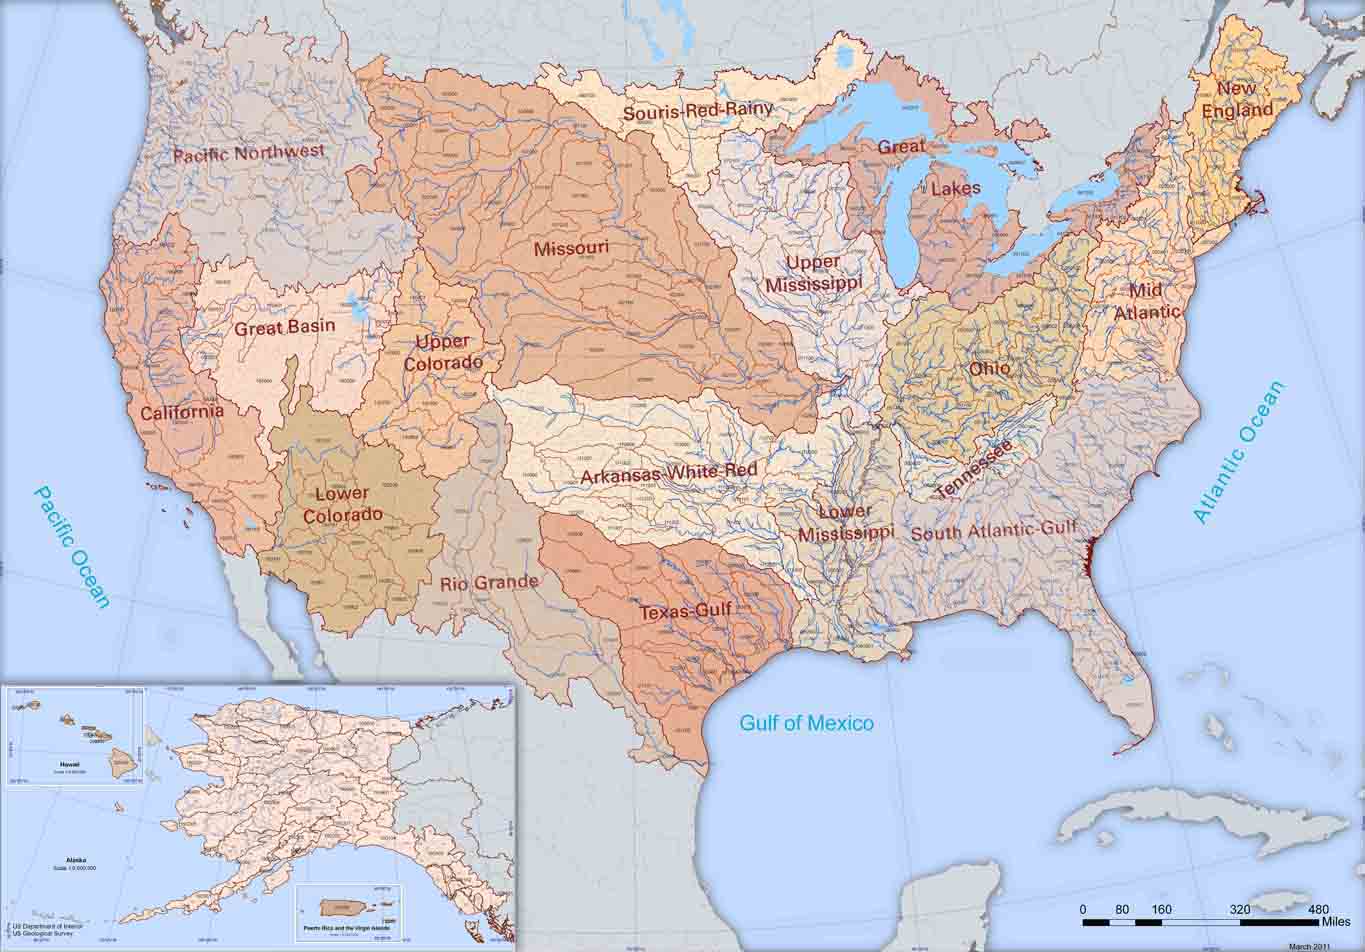
The Watershed Boundary Dataset (WBD) from The National Map (TNM) defines the perimeter of drainage areas formed by the terrain and other landscape characteristics. The drainage areas are nested within each other so that a large drainage area, such as the Upper Mississippi River, will be composed of multiple smaller drainage areas, such as the Wisconsin River. Each of these smaller areas can further be subdivided into smaller and smaller drainage areas. The WBD uses six different levels in this hierarchy, with the smallest averaging about 30,000 acres. The WBD is made up of polygons nested into six levels of data respectively defined by Regions, Subregions, Basins, Subbasins, Watersheds, and Subwatersheds. For additional...
Temporal patterns in glyphosate and atrazine concentrations were measured weekly by the U.S. Geological Survey (USGS) during the 2013 growing season in 100 small streams in the Midwestern United States. Concentrations also were measured every 2 days at a subset of 8 of the sites, all located in Missouri. Glyphosate was detected more frequently in urban streams than in agricultural streams, and at concentrations similar to those in streams with high agricultural land use in the watershed. In contrast, atrazine was detected more frequently and at higher concentrations in agricultural streams than in urban streams. This data release provides watershed characteristics and 2013 glyphosate and atrazine compound concentrations...
Types: Map Service,
OGC WFS Layer,
OGC WMS Layer,
OGC WMS Service;
Tags: Corn Belt,
ELISA,
Illinois,
Indiana,
Iowa,
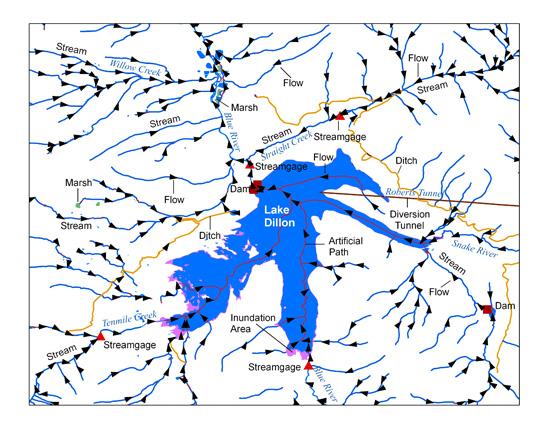
The USGS National Hydrography Dataset (NHD) service from The National Map (TNM) is a comprehensive set of digital spatial data that encodes information about naturally occurring and constructed bodies of surface water (lakes, ponds, and reservoirs), paths through which water flows (canals, ditches, streams, and rivers), and related entities such as point features (springs, wells, stream gages, and dams). The information encoded about these features includes classification and other characteristics, delineation, geographic name, position and related measures, a "reach code" through which other information can be related to the NHD, and the direction of water flow. The network of reach codes delineating water and...
In 1991, the U.S. Geological Survey (USGS) began a study of more than 50 major river basins across the Nation as part of the National Water-Quality Assessment (NAWQA) project of the National Water-Quality Program. One of the major goals of the NAWQA project is to determine how water-quality and ecological conditions change over time. To support that goal, long-term consistent and comparable ecological monitoring has been conducted on streams and rivers throughout the Nation. Fish, invertebrate, and algae data collected as part of the NAWQA program were retrieved from the USGS Aquatic Bioassessment database for use in trend analysis. Ultimately, these data will provide insight into how natural features and human...
Digital flood-inundation maps for a 3.4-mile reach of North Fork Salt Creek at Nashville, Indiana, were created by the U.S. Geological Survey (USGS) in cooperation with the Indiana Department of Transportation. The flood-inundation maps, which can be accessed through the USGS Flood Inundation Mapping Science Web site at http://water.usgs.gov/osw/flood_inundation/, depict estimates of the areal extent and depth of flooding corresponding to selected water levels (stages) at the USGS streamgage 03371650, North Fork Salt Creek at Nashville, Ind. Real-time stages at this streamgage may be obtained on the Internet from the USGS National Water Information System at http://waterdata.usgs.gov/nwis or the National Weather...
These data are bathymetry (river bottom elevation) in XYZ format (Easting, Northing, Elevation), generated from the September 17–18, 2020, survey of the Kentucky Dam tailwater from just downstream from Kentucky Dam to approximately 1,500 feet upstream from the I-24 bridge (about 1 mile total length). Bathymetric data were collected using an acoustic Doppler current profiler (ADCP) with an integrated global navigation satellite system (GNSS) smart antenna. The ADCP and GNSS antenna were mounted on a marine survey vessel, and data were collected as the survey vessel traversed the tailwater along planned survey lines. There was typically one reciprocal pair (two passes) of data collected per line. There was a total...
Categories: Data;
Tags: Gilbertsville,
Kentucky,
Kentucky Dam,
Tennessee River,
United States of America,
The U.S. Geological Survey collected field spectra collected from three rivers in Alaska September 19–21, 2016, to support research on remote sensing of river discharge. Reflectance measurements were made from bridges across the Chena River, Salcha River, and Montana Creek using an Analytical Spectral Devices FieldSpec3 spectroradiometer operated in reflectance mode. The original *.asd files are provided in this data release. This data release supports the following article: Legleiter, C.J., Kinzel, P.J., and Nelson, J.M., 2017, Remote measurement of river discharge using thermal particle image velocimetry (PIV) and various sources of bathymetric information: Journal of Hydrology, v. 554, p. 490-506, https://doi.org/10.1016/j.jhydrol.2017.09.004.
Categories: Data;
Types: Downloadable,
Map Service,
OGC WFS Layer,
OGC WMS Layer,
OGC WMS Service,
Shapefile;
Tags: Alaska,
Chena River,
Montana Creek,
Salcha River,
USGS Science Data Catalog (SDC),
These data were released prior to the October 1, 2016 effective date for the USGS’s policy dictating the review, approval, and release of scientific data as referenced in USGS Survey Manual Chapter 502.8 Fundamental Science Practices: Review and Approval of Scientific Data for Release. This data set contains the main stem of the Humboldt River as defined by Humboldt Project personnel of the U.S. Geological Survey Nevada District, 2001. The data set was digitized on screen using digital orthophoto quadrangles from 1994.

The Digital Elevation Model (DEM) utilized for this Willamette FIS submittal was produced by combining multiple overlapping topographic surveys for the Middle Fork and Coast Fork of the Willamette River. The DEM was created from four sources: LIDAR of the Springfield area that was flown in 2008, LIDAR of Silk Creek that was flown in 2011, LIDAR of Fall Creek that was flown in 2012, and photogrammetry of the Middle Fork and Coast Fork of the Willamette River that was flown in 2004. In areas where no high-resolution elevation data were available, USGS National Elevation Dataset (NED) data were used to supplement the DEM. This feature represents the areas NED information is presented. The horizontal datum of the DEM...
The project will complete an extensive mapping of coastal change along the entire coastline of the Western Alaska Landscape Conservation Cooperative (LCC). The work will provide important baseline information on the distribution and magnitude of landscape changes over the past 41 years. The extent of change to the coastline and to coastal features, such as spits, barrier islands, estuaries, tidal guts and lagoons, is known to be substantial in some areas along the coast (e.g., portions of the Yukon–Kuskokwim Delta), although the extent of change along the full Bering Sea coast is not well documented. With this analysis, changes can be summarized for different land ownerships or other units to assess the extent of...
Categories: Data,
Project;
Tags: BARRIER ISLANDS,
BARRIER ISLANDS,
COASTAL LANDFORMS/PROCESSES,
COASTAL LANDFORMS/PROCESSES,
DEGRADATION,
The National Hydrography Dataset (NHD) is a feature-based database that interconnects and uniquely identifies the stream segments or reaches that make up the nation's surface water drainage system. NHD data was originally developed at 1:100,000-scale and exists at that scale for the whole country. This high-resolution NHD, generally developed at 1:24,000/1:12,000 scale, adds detail to the original 1:100,000-scale NHD. (Data for Alaska, Puerto Rico and the Virgin Islands was developed at high-resolution, not 1:100,000 scale.) Local resolution NHD is being developed where partners and data exist. The NHD contains reach codes for networked features, flow direction, names, and centerline representations for areal water...
Categories: Data;
Types: Citation;
Tags: Administrative watershed units,
Area of Complex Channels,
Area to be submerged,
Basin,
Bay/Inlet,
Two unique datasets were gathered to document whether flow management for hydropower affects the abundance and diversity of aquatic insect assemblages. The first dataset was collected in Grand Canyon from 2012-2014 by citizen scientists rafting the Colorado River. Simple light traps were set out each night in camp and used to capture the adult life stages of aquatic insects that emerged from the Colorado River. Three aquatic insect taxa were captured in sufficient abundance to analyze statistically including midges (order Diptera, family Chironomidae), micro-caddisflies (order Trichoptera, family Hydroptilidae), and blackflies (order Diptera, family Simuliidae, principally Simulium arcticum). These data were used...
|

|
