Filters: Tags: river (X)
473 results (39ms)|
Filters
Date Range
Extensions Types
Contacts
Categories
Tag Types
|
Despite the lack of surface flows, the Colorado River riparian corridor in Mexico has proven to be ecologically resilient. Floods in the 1980s and 90s in the region brought back large swaths of native riparian habitat, which still persist today in some areas along the river. Because the historic floodplain is extremely important for agricultural production and therefore the local economy, habitat maintenance must be integrated with continued utilization of lands and water for this purpose.The riparian, marsh, and open-water areas found in Reach 4 provide critical habitat for both migratory and resident riparian bird species. Due to its ecological importance, the riparian corridor and Reach 4 in particular have been...
Categories: Data;
Types: ArcGIS REST Map Service,
ArcGIS Service Definition,
Downloadable,
Map Service,
OGC WFS Layer,
OGC WMS Layer,
OGC WMS Service;
Tags: 2014,
Applications and Tools,
Baja California,
Colorado River Delta,
Data,
A two-dimensional model and digital flood-inundation maps were developed for a 30-mile reach of the Wabash River near the Interstate 64 (I-64) Bridge near Grayville, Illinois. The flood-inundation maps, which can be accessed through the U.S. Geological Survey (USGS) Flood Inundation Mapping Science web site at http://water.usgs.gov/osw/flood_inundation/, depict estimates of the areal extent and depth of flooding corresponding to selected water levels (stages) at the USGS streamgage on the Wabash River at Mount Carmel, Ill (USGS station number 03377500). Near-real-time stages at this streamgage may be obtained on the internet from the USGS National Water Information System at http://waterdata.usgs.gov/ or the National...
Categories: Data;
Types: Citation;
Tags: Geomorphology,
Gibson County,
Grayville,
Hydrogeology,
Illinois,
These data are measurements of sediment depth in the downstream approach channel of Brandon Rd Lock and Dam at Joliet, Illinois, on February 13-14, 2017. Data collection software recorded and stored the horizontal position of the vessel and the measured sediment depth. Data processing required computer software to extract position data from the target data files and to summarize and map the information.
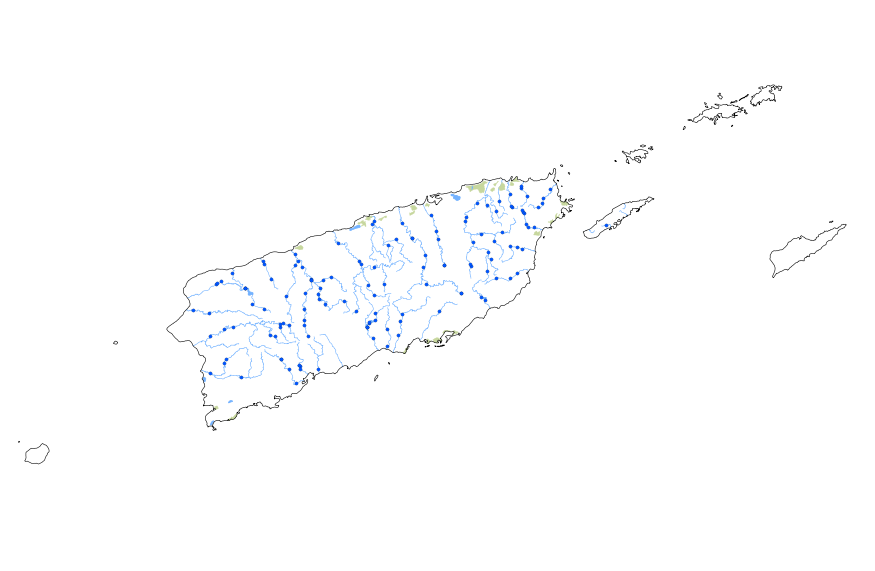
This geodatabase contains streams, waterbodies and wetlands, streamflow gaging stations, and coastlines for Puerto Rico and the U.S. Virgin Islands. The streams are incorporated into a geometric network. All feature classes are vertically integrated with each other and with 1:1,000,000-scale transportation and boundary data sets.

Major rivers and water bodies derived from Metro's Riv_poly data layer. Includes: the Columbia, Willamette, Sandy, Clackamas and Lewis Rivers; Lake Oswego; Smith, Bybee, Vancouver and Sturgeon Lakes. Downloaded from Metro's RLIS Discovery site 7/2/2012.
After a long period in which fuel loads were sparse, fire recently has occurred with high frequency in the ungrazed riparian zone of the Upper San Pedro River in southern Arizona’s Chihuahuan Desert. We studied four accidental fires that occurred during 1994–2003 (two in different years at the same site). Woody vegetation was contrasted between three burned sites and matched spatial controls, and before and after the most recent fire. Herbaceous vegetation was sampled in multiple years producing a chronosequence of time since fire (from 4 months to 8 years). Riparian fire was associated with reductions in woody plant species diversity and canopy cover. In contrast, fire caused a short-term (2 year) pulse of...
Categories: Publication;
Types: Citation,
Journal Citation;
Tags: Restoration Ecology,
disturbance,
diversity,
dryland,
fire,

Outlet points represent the physical outlet of natural flow subbasins as represented in the Colorado River Simulation System (CRSS). These points typically coincide with a past or present USGS gauge or the outlet from a reservoir. There are 30 such points within the Upper and Lower Colorado River Basin.
The U.S. Geological Survey collected field spectra collected from the Niobrara River in Nebraska August 15–18, 2016, to support research on remote sensing of river discharge. Reflectance measurements were made by wading the Niobrara River near Norden Notch using an Analytical Spectral Devices FieldSpec3 spectroradiometer operated in reflectance mode. The original *.asd files are provided in this data release.
Categories: Data;
Types: Citation,
Downloadable,
Map Service,
OGC WFS Layer,
OGC WMS Layer,
OGC WMS Service,
Shapefile;
Tags: Nebraska,
Niobrara River,
USGS Science Data Catalog (SDC),
bathymetry,
depth,
Detecting trends in biological attributes is central to many stream monitoring programs; however, understanding how natural variability in environmental factors affects trend results is not well understood. We evaluated the influence of antecedent streamflow and sample timing (covariates) on trend estimates for fish, invertebrate, and diatom taxa richness and biolgical condition from 2002 to 2012 at 51 sites distributed across the conterminous United States. This data release contains all of the input and output files necessary to reproduce the results presented and discussed in the associated journal article.
The development and the generation of the datasets that are published through this data release, were based on the results and findings of this report: Kohn, M.S. and Patton, T.T., 2018, Flood-Inundation Maps for the South Platte River at Fort Morgan, Colorado, 2018: U.S. Geological Survey Scientific Investigations Report 2018-5114, 14 p., https://doi.org/10.3133/sir20185114. The model archive dataset contains all relevant files to document and re-run the surface-water hydraulic model that are discussed in the report. The model archive contains two model runs, the calibration model run and the flood inundation model run. Digital flood-inundation maps for a 4.5-mile reach of the South Platte River at Fort Morgan,...
Types: Map Service,
OGC WFS Layer,
OGC WMS Layer,
OGC WMS Service;
Tags: Colorado (CO),
Fort Morgan,
GIS,
Morgan County,
South Platte River,
To support research on dispersion in river channels, a tracer dye experiment was performed on the Kootenai River in northern Idaho, September 25-27, 2017. This data release provides access to digital aerial photography acquired during the experiment and the supporting field-based measurements of reflectance and dye concentration are available through related data releases. The digital aerial photography was acquired by the U.S. Fish and Wildlife Service using a Phase One iXU180-R mapping camera deployed from a Partenavia manned aircraft from a flying height of approximately 600 m above ground level. The data product included in this release is an orthorectified mosaic in JPEG2000 (*.jp2) format produced from a...
Categories: Data,
Data Release - In Progress;
Types: Map Service,
OGC WFS Layer,
OGC WMS Layer,
OGC WMS Service;
Tags: Bonners Ferry,
Idaho,
Kootenai River,
aerial photography,
channel,
This dataset was developed for the BLM-Rapid Ecoregional Assessment (REA) project for the Seward Peninsula - Nulato Hills - Kotzebue Sound Lowlands. This datasets represents the Aquatic Coarse Filters (freshwater lake - large, connected, freshwater lake - large isolated, freshwater lake - small, connected, and freshwater lake - small, isolated). The waterbody feature classes in the National Hydrography Dataset (NHD) geodatabases for the project area were used to identify and classify lakes for the final lakes dataset.
The National Hydrography Dataset (NHD) is a feature-based database that interconnects and uniquely identifies the stream segments or reaches that make up the nation's surface water drainage system. NHD data was originally developed at 1:100,000-scale and exists at that scale for the whole country. This high-resolution NHD, generally developed at 1:24,000/1:12,000 scale, adds detail to the original 1:100,000-scale NHD. (Data for Alaska, Puerto Rico and the Virgin Islands was developed at high-resolution, not 1:100,000 scale.) Local resolution NHD is being developed where partners and data exist. The NHD contains reach codes for networked features, flow direction, names, and centerline representations for areal water...
The NHDPlus Version 1.0 is an integrated suite of application-ready geospatial data sets that incorporate many of the best features of the National Hydrography Dataset (NHD) and the National Elevation Dataset (NED). The NHDPlus includes a stream network (based on the 1:100,000-scale NHD), improved networking, naming, and "value-added attributes" (VAA's). NHDPlus also includes elevation-derived catchments (drainage areas) produced using a drainage enforcement technique first broadly applied in New England, and thus dubbed "The New-England Method". This technique involves "burning-in" the 1:100,000-scale NHD and when available building "walls" using the national Watershed Boundary Dataset (WBD). The resulting modified...
The NHDPlus Version 1.0 is an integrated suite of application-ready geospatial data sets that incorporate many of the best features of the National Hydrography Dataset (NHD) and the National Elevation Dataset (NED). The NHDPlus includes a stream network (based on the 1:100,000-scale NHD), improved networking, naming, and "value-added attributes" (VAA's). NHDPlus also includes elevation-derived catchments (drainage areas) produced using a drainage enforcement technique first broadly applied in New England, and thus dubbed "The New-England Method". This technique involves "burning-in" the 1:100,000-scale NHD and when available building "walls" using the national Watershed Boundary Dataset (WBD). The resulting modified...
This map shows all the places conservation elements. Some of the places included exhibit high biodiversity or ecological and cultural value. This map also shows other managed areas from the Protected Areas Database, as well as those that are excluded. Associated input datasets are also included; they relate to biodiversity, special areas, and development. These data are provided by Bureau of Land Management (BLM) "as is" and may contain errors or omissions. The User assumes the entire risk associated with its use of these data and bears all responsibility in determining whether these data are fit for the User's intended use. These data may not have the accuracy, resolution, completeness, timeliness, or other characteristics...
This U.S. Geological Survey data release provides surface-water quality, streamflow, and groundwater-elevation data collected within the Central Pine Barrens (CPB) Region of Suffolk County, New York, from October 1, 2019 through September 30, 2020. The data were collected in cooperation with the Central Pine Barrens Commission and the Town of Brookhaven as part of a five-year comprehensive water-resources monitoring program. Water quality and quality-assurance data from seven sites on two rivers (Carmans River- five sites and Peconic River- two sites) in the CPB are included. Carmans River sites were sampled four times throughout the year (fall, winter, spring, and summer) and Peconic River sites were sampled twice...
Categories: Data,
Data Release - Revised;
Types: Downloadable,
Map Service,
OGC WFS Layer,
OGC WMS Layer,
Shapefile;
Tags: 62d9650bd34e2842e1edcf5a,
Ambient Monitoring,
Contaminants, Emerging,
Contaminants, Natural,
Contaminants, Organic,
Despite the lack of surface flows, the Colorado River riparian corridor in Mexico has proven to be ecologically resilient. Floods in the 1980s and 90s in the region brought back large swaths of native riparian habitat, which still persist today in some areas along the river. Because the historic floodplain is extremely important for agricultural production and therefore the local economy, habitat maintenance must be integrated with continued utilization of lands and water for this purpose.The riparian, marsh, and open-water areas found in Reach 4 provide critical habitat for both migratory and resident riparian bird species. Due to its ecological importance, the riparian corridor and Reach 4 in particular have been...
Categories: Data,
Project;
Types: ArcGIS REST Map Service,
ArcGIS Service Definition,
Downloadable,
Map Service,
OGC WFS Layer,
OGC WMS Layer,
OGC WMS Service;
Tags: 2014,
Applications and Tools,
Baja California,
Colorado River Delta,
DLCC,
This dataset has been archived; it has been superseded by version 1.1 (January 2023) which can be found at https://doi.org/10.5066/P9IOJLQ1. This U.S. Geological Survey Data Release provides surface-water and bed sediment quality data at the Bronx River, New York, 2019. The data were collected with support from the Urban Waters Federal Partnership (UWFP) and others. Surface-water samples were collected at six locations along the Bronx River and analyzed for poly- and perfluoroalkyl substances (PFAS), pharmaceuticals, and pesticides. Water-quality field parameters such as pH, specific conductance dissolved oxygen, water temperature, and turbidity were measured during each site visit. Each surface-water site was...
Consumption rates and total mercury concentration of food items and consumers collected at six sites on the Colorado River in the Grand Canyon. Sites ranged from 0-367 river kilometers downstream of Lees Ferry (AZ, USA). Samples were analyzed for total Hg using cold vapor atomic fluorescence (CVAF, Tekran Model 2600 CVAF spectrometer) following EPA Method 7474. Consumption rate samples were collected quarterly from July 1, 2007 to June 30, 2009. Food items and consumers were collected June 12-28 2008.
|

|
