Filters: Tags: rogue river (X)
31 results (53ms)|
Filters
Date Range
Extensions Types Contacts
Categories Tag Types
|

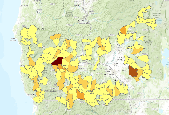
The rrbasin_barriers shapefile (polygons) contains weighted scores that assess the impact of fish barriers on sixth field watersheds within the Rogue River Basin. Original barrier data were provided by the Rogue Basin Fish Access Team (RBFAT).This is Figure 18 from the report titled "Assessment of Aquatic Habitat Monitoring Data in the Rogue River Basin and Southern Oregon Coastal Streams" (January 2003) by Conservation Biology Institute.For more information, please review the full report.

These data were released prior to the October 1, 2016 effective date for the USGS’s policy dictating the review, approval, and release of scientific data as referenced in USGS Survey Manual Chapter 502.8 Fundamental Science Practices: Review and Approval of Scientific Data for Release. The Rogue River drains 13,390 square kilometers of southwestern Oregon before flowing into the Pacific Ocean near the town of Gold Beach, Oregon. The Rogue River begins in the Cascade Range and traverses the Klamath Mountains, where it gains its largest tributaries, the Applegate (1,994 square kilometers) and Illinois (2,564 square kilometers) Rivers, on its way to the coast. In cooperation with the U.S. Army Corps of Engineers,...

The rrbasin_ssranks shapefile (polygon) contains CBI determined ranks for aquatic habitat, based on Oregon Fish and Wildlife (ODFW) and USFS (Rogue and Siskiyou NFs) stream surveys.This is Figure 17 from the report titled "Assessment of Aquatic Habitat Monitoring Data in the Rogue River Basin and Southern Oregon Coastal Streams" (January 2003) by Conservation Biology Institute.For more information, please review the full report.

These data were released prior to the October 1, 2016 effective date for the USGS’s policy dictating the review, approval, and release of scientific data as referenced in USGS Survey Manual Chapter 502.8 Fundamental Science Practices: Review and Approval of Scientific Data for Release. The Rogue River drains 13,390 square kilometers of southwestern Oregon before flowing into the Pacific Ocean near the town of Gold Beach, Oregon. The Rogue River begins in the Cascade Range and traverses the Klamath Mountains, where it gains its largest tributaries, the Applegate (1,994 square kilometers) and Illinois (2,564 square kilometers) Rivers, on its way to the coast. In cooperation with the U.S. Army Corps of Engineers,...

These data were released prior to the October 1, 2016 effective date for the USGS’s policy dictating the review, approval, and release of scientific data as referenced in USGS Survey Manual Chapter 502.8 Fundamental Science Practices: Review and Approval of Scientific Data for Release. The Rogue River drains 13,390 square kilometers of southwestern Oregon before flowing into the Pacific Ocean near the town of Gold Beach, Oregon. The Rogue River begins in the Cascade Range and traverses the Klamath Mountains, where it gains its largest tributaries, the Applegate (1,994 square kilometers) and Illinois (2,564 square kilometers) Rivers, on its way to the coast. In cooperation with the U.S. Army Corps of Engineers,...

The rrbasin_ssranks shapefile (polygon) contains CBI determined ranks for aquatic habitat, based on Oregon Fish and Wildlife (ODFW) and USFS (Rogue and Siskiyou NFs) stream surveys.This is Figure 17 from the report titled "Assessment of Aquatic Habitat Monitoring Data in the Rogue River Basin and Southern Oregon Coastal Streams" (January 2003) by Conservation Biology Institute.For more information, please review the full report.
The rrbasin_inverts shapefile (polygons) contains ranks that represent the habitat integrity of the watershed (HUC6) based on aquatic macroinvertebrate bioassessment scores calculated by Aquatic Biology Associates (ABA).This is Figure 15 from the report titled "Assessment of Aquatic Habitat Monitoring Data in the Rogue River Basin and Southern Oregon Coastal Streams" (January 2003) by Conservation Biology Institute.For more information, please review the full report.
This data set contains imagery from the National Agriculture Imagery Program (NAIP). The NAIP program is administered by USDA FSA and has been established to support two main FSA strategic goals centered on agricultural production. These are, increase stewardship of America's natural resources while enhancing the environment, and to ensure commodities are procured and distributed effectively and efficiently to increase food security. The NAIP program supports these goals by acquiring and providing ortho imagery that has been collected during the agricultural growing season in the U.S. The NAIP ortho imagery is tailored to meet FSA requirements and is a fundamental tool used to support FSA farm and conservation programs....

The rrbasin_differencemaps shapefile (polygons) contains comparison scores that assess the difference between the 2000 Rogue Basin Assessment (road density, road-stream intersections, and forest change) and the 2002 Rogue Basin Assessment (stream temperature, aquatic invertebrates, and stream survey data) for sixth field watersheds within the Rogue River Basin.This is Figure 20 (Model 1) from the report titled "Assessment of Aquatic Habitat Monitoring Data in the Rogue River Basin and Southern Oregon Coastal Streams" (January 2003) by Conservation Biology Institute.For more information, please review the full report.

These data were released prior to the October 1, 2016 effective date for the USGS’s policy dictating the review, approval, and release of scientific data as referenced in USGS Survey Manual Chapter 502.8 Fundamental Science Practices: Review and Approval of Scientific Data for Release. The Rogue River drains 13,390 square kilometers of southwestern Oregon before flowing into the Pacific Ocean near the town of Gold Beach, Oregon. The Rogue River begins in the Cascade Range and traverses the Klamath Mountains, where it gains its largest tributaries, the Applegate (1,994 square kilometers) and Illinois (2,564 square kilometers) Rivers, on its way to the coast. In cooperation with the U.S. Army Corps of Engineers,...

The rrbasin_perc_surv shapefile (polygon) contains percentages of 100k streams that have been surveyed by ODFW and USFS. The percentage was calculated for streams within each 6th field HUC in the Rogue River Basin, Oregon.This is Figure 16 from the report titled "Assessment of Aquatic Habitat Monitoring Data in the Rogue River Basin and Southern Oregon Coastal Streams" (January 2003) by Conservation Biology Institute.For more information, please review the full report.

The rrbasin_ssranks shapefile (polygon) contains CBI determined ranks for aquatic habitat, based on Oregon Fish and Wildlife (ODFW) and USFS (Rogue and Siskiyou NFs) stream surveys.This is Figure 17 from the report titled "Assessment of Aquatic Habitat Monitoring Data in the Rogue River Basin and Southern Oregon Coastal Streams" (January 2003) by Conservation Biology Institute.For more information, please review the full report.

The rrbasin_ssranks shapefile (polygon) contains CBI determined ranks for aquatic habitat, based on Oregon Fish and Wildlife (ODFW) and USFS (Rogue and Siskiyou NFs) stream surveys.This is Figure 16 from the report titled "Assessment of Aquatic Habitat Monitoring Data in the Rogue River Basin and Southern Oregon Coastal Streams" (January 2003) by Conservation Biology Institute.For more information, please review the full report.

The summer_huc6_temp_v5 shapefile (polygons) contains threshold scores that assess the intensity of maximum temperature impacts within sixth field watersheds of the Rogue River Basin. Continuous and summary temperature data was provided by the Medford and Portland Oregon DEQ offices and include data from watershed councils, national forest service, bureau of land management, Oregon DEQ, Oregon Department of Forestry and Oregon Department of Fish and Wildlife. Additional summary data for 1997-2001 was taken from the Rogue River Basin Cooperative Stream Temperature Monitoring 1993-1997 Report and summary tables of RRNF data (1993 - 2001) provided by John Brazier of the Rogue River National Forest.This is Figure 14...

These data were released prior to the October 1, 2016 effective date for the USGS’s policy dictating the review, approval, and release of scientific data as referenced in USGS Survey Manual Chapter 502.8 Fundamental Science Practices: Review and Approval of Scientific Data for Release. The Rogue River drains 13,390 square kilometers of southwestern Oregon before flowing into the Pacific Ocean near the town of Gold Beach, Oregon. The Rogue River begins in the Cascade Range and traverses the Klamath Mountains, where it gains its largest tributaries, the Applegate (1,994 square kilometers) and Illinois (2,564 square kilometers) Rivers, on its way to the coast. In cooperation with the U.S. Army Corps of Engineers,...

These data were released prior to the October 1, 2016 effective date for the USGS’s policy dictating the review, approval, and release of scientific data as referenced in USGS Survey Manual Chapter 502.8 Fundamental Science Practices: Review and Approval of Scientific Data for Release. The Rogue River drains 13,390 square kilometers of southwestern Oregon before flowing into the Pacific Ocean near the town of Gold Beach, Oregon. The Rogue River begins in the Cascade Range and traverses the Klamath Mountains, where it gains its largest tributaries, the Applegate (1,994 square kilometers) and Illinois (2,564 square kilometers) Rivers, on its way to the coast. In cooperation with the U.S. Army Corps of Engineers,...
This data set contains imagery from the National Agriculture Imagery Program (NAIP). The NAIP program is administered by USDA FSA and has been established to support two main FSA strategic goals centered on agricultural production. These are, increase stewardship of America's natural resources while enhancing the environment, and to ensure commodities are procured and distributed effectively and efficiently to increase food security. The NAIP program supports these goals by acquiring and providing ortho imagery that has been collected during the agricultural growing season in the U.S. The NAIP ortho imagery is tailored to meet FSA requirements and is a fundamental tool used to support FSA farm and conservation programs....

These data were released prior to the October 1, 2016 effective date for the USGS’s policy dictating the review, approval, and release of scientific data as referenced in USGS Survey Manual Chapter 502.8 Fundamental Science Practices: Review and Approval of Scientific Data for Release. The Rogue River drains 13,390 square kilometers of southwestern Oregon before flowing into the Pacific Ocean near the town of Gold Beach, Oregon. The Rogue River begins in the Cascade Range and traverses the Klamath Mountains, where it gains its largest tributaries, the Applegate (1,994 square kilometers) and Illinois (2,564 square kilometers) Rivers, on its way to the coast. In cooperation with the U.S. Army Corps of Engineers,...
Categories: pre-SM502.8;
Tags: Applegate River,
Curry County,
Illinois River,
Jackson County,
Josephine County,

The rrbasin_differencemaps shapefile (polygons) contains comparison scores that assess the difference between the 2000 Rogue Basin Assessment (road density, road-stream intersections, and forest change) and the 2002 Rogue Basin Assessment (stream temperature, aquatic invertebrates, and stream survey data) for sixth field watersheds within the Rogue River Basin.This is Figure 20 (Model 2) from the report titled "Assessment of Aquatic Habitat Monitoring Data in the Rogue River Basin and Southern Oregon Coastal Streams" (January 2003) by Conservation Biology Institute.For more information, please review the full report.
This data set contains imagery from the National Agriculture Imagery Program (NAIP). The NAIP program is administered by USDA FSA and has been established to support two main FSA strategic goals centered on agricultural production. These are, increase stewardship of America's natural resources while enhancing the environment, and to ensure commodities are procured and distributed effectively and efficiently to increase food security. The NAIP program supports these goals by acquiring and providing ortho imagery that has been collected during the agricultural growing season in the U.S. The NAIP ortho imagery is tailored to meet FSA requirements and is a fundamental tool used to support FSA farm and conservation programs....
|

|
