Filters: Tags: simulation (X)
408 results (193ms)|
Filters
Date Range
Extensions Types Contacts
Categories Tag Types
|

Soil residual water corresponds to the model variable "total streamflow." In the model MC1, this is calculated (in cm of water) as the water flowing through the soil profile below the last soil layer (streamflow), water leached into the subsoil (baseflow) and also includes runoff. The output is presented here as a monthly average. Soil residual water is part of the model output from Brendan Rogers' MS thesis work. Brendan used the vegetation model MC1 to simulate vegetation dynamics, associated carbon and nitrogen cycle, water budget and wild fire impacts across the western 2/3 of the states of Oregon and Washington using climate input data from the PRISM group (Chris Daly, OSU) at a 30arc second (800m) spatial...

Soil residual water corresponds to the model variable "total streamflow." In the model MC1, this is calculated (in cm of water) as the water flowing through the soil profile below the last soil layer (streamflow), water leached into the subsoil (baseflow) and also includes runoff. The output is presented here as a monthly average. Soil residual water is part of the model output from Brendan Rogers' MS thesis work. Brendan used the vegetation model MC1 to simulate vegetation dynamics, associated carbon and nitrogen cycle, water budget and wild fire impacts across the western 2/3 of the states of Oregon and Washington using climate input data from the PRISM group (Chris Daly, OSU) at a 30arc second (800m) spatial...

This map represents the change between 1971-2000 and 2070-2099 in the annual peak fraction of total live vegetation carbon held in herbaceous plants, as simulated by the model MC1 under the Hadley future climate projection and A2 anthropogenic emissions scenario. The fraction of total live vegetation carbon held in herbaceous plants for the respective 30-year periods increased in some of the 5,311 grid cells of the Apache-Sitgreaves study area and decreased in others.The range of data values is from -0.817 to +0.999. The mean value is +0.210. Data values are calculated as GFRAC(2070-2099) minus GFRAC(1971-2000). GFRAC data is from MC1 version B60. The vegetation model MC1 (e.g. Bachelet et al. 2001) was used...

MC1 is a dynamic vegetation model for estimating the distribution of vegetation and associated ecosystem fluxes of carbon, nutrients, and water. It was created to assess the potential impacts of global climate change on ecosystem structure and function at a wide range of spatial scales from landscape to global. The model incorporates transient dynamics to make predictions about the patterns of ecological change. MC1 was created by combining physiologically based biogeographic rules defined in the MAPSS model with a modified version of the biogeochemical model, CENTURY. MC1 includes a fire module, MCFIRE, that mechanistically simulates the occurrence and impacts of fire events. Climate input data sources for this...

MC1 is a dynamic vegetation model for estimating the distribution of vegetation and associated ecosystem fluxes of carbon, nutrients, and water. It was created to assess the potential impacts of global climate change on ecosystem structure and function at a wide range of spatial scales from landscape to global. The model incorporates transient dynamics to make predictions about the patterns of ecological change. MC1 was created by combining physiologically based biogeographic rules defined in the MAPSS model with a modified version of the biogeochemical model, CENTURY. MC1 includes a fire module, MCFIRE, that mechanistically simulates the occurrence and impacts of fire events. Climate input data sources for this...

This map is one of the layers used to recreate Figure 2 in Churkina and Running (1998) in Data Basin (file title: Climate controls on plant growth) Each pixel (0.5 x 0.5) on the map represents a value derived from a specific function of annual mean temperature (Figure 1 in Churkina and Running 1998). Exerpt from Churkina and Running 1998: Though extreme low mean annual temperatures restrict vegetation productivity, less extreme low temperatures may also limit plant productivity during the period of maximum growth. The degree of thermal limitation on NPP gradually declines as the annual temperatures rise; the limitation increases again when the annual temperatures get too high. Vegetation productivity can be...

For his MS thesis, Brendan Rogers used the vegetation model MC1 to simulate vegetation dynamics, associated carbon and nitrogen cycle, water budget and wild fire impacts across the western 2/3 of the states of Oregon and Washington using climate input data from the PRISM group (Chris Daly, OSU) at a 30arc second (800m) spatial grain. The model was run from 1895 to 2100 assuming that nitrogen demand from the plants was always met so that the nitrogen concentrations in various plant parts never dropped below their minimum reported values. A CO2 enhancement effect increased productivity and water use efficiency as the atmospheric CO2 concentration increased. Future climate change scenarios were generated through statistical...

This dataset depicts dominant species groups in Minnesota (USA) at year 0 (1995) from a single model run of LANDIS-II. The simulation assumed Intergovernmental Panel on Climate Change (IPCC) A2 emissions (moderate) and used the Hadley 3 global circulation model. Restoration harvest rates and intensities were simulated. Restoration harvesting was spatially allocated following ecological land units (rather than ownership) and harvest frequency, severity, and size distributions were based on historic wind and fire regimes. The projected dominant species were listed as follows: 1) Spruce and Fir; 2) Northern Hardwoods: Sugar Maple; 3) Northern Hardwoods: Red Maple; 4) Aspen and Birch; 5) White, Red, and Jack Pine; 6)...

This dataset represents presence of Red Pine (Pinus resinosa) at year 100 (2095) in Minnesota (USA) from a single model run of LANDIS-II. The simulation assumed Intergovernmental Panel on Climate Change (IPCC) B2 emissions (moderate) and used the Hadley 3 global circulation model. Contemporary harvest rates and intensities were simulated.

This dataset represents presence of Sugar Maple (Acer saccharum) in Minnesota (USA) at year 100 (2095) from a single model run of LANDIS-II. The simulation assumed Intergovernmental Panel on Climate Change (IPCC) B2 emissions (moderate) and used the Hadley 3 global circulation model. Contemporary harvest rates and intensities were simulated.

MC1 results were produced for the MsTMIP (Multi-scale Synthesis and Terrestrial Model Intercomparison Project: http://nacp.ornl.gov/MsTMIP.shtml). This dataset shows net ecosystem productivity simulated by MC1 for the spinup phase for the conterminous US at 0.5 degree resolution. Input data come from CRU (http://www.cru.uea.ac.uk/). In this case, spinup climate is a random sequence of 100 years chosen from the period 1901-1930. The results were aggregated by 25 year-periods for the animation. For display purposes, the start date for this time sequence was set to January 1, 1900.

Description of Work USGS is creating forecasting tools for managers to determine how water withdrawals or other hydrologic or land use changes in watersheds may affect Great Lakes ecosystems. This project is determining fish distributions in Great Lakes tributaries and how changes in stream flow may affect them. This information will help guide restoration efforts to achieve maximum effectiveness and success. Estimates were produced using WATER - a TOPMODEL based tool that estimates streamflow at any point along the stream network. The pour point is selected using a point-and-click GUI that samples information about the basin using a geodatabase of topographic and soil data spatial layers.
Categories: Project;
Tags: GLRI,
Great Lakes,
Great Lakes Restoration Initiative,
Great Lakes Restoration Initiative,
Lake,
This dataset represents the historical mean annual area burned per ~ 4 km pixel, averaged for each HUC5 watershed, simulated by the model MC1 for the 30-year period 1971-2000. Historical mean area burned per year (in square meters) per ~4 km pixel was averaged across each HUC5 watershed. Watersheds represent 5th level (HUC5, 10-digit) hydrologic unit boundaries and were acquired from the Natural Resources Conservation Service. Background: The dynamic global vegetation model MC1 (see Bachelet et al.2001) was used to simulate vegetation dynamics, associated carbon and nitrogen cycle, water budget, and wild fire impacts for OR, WA, AZ and NM, for a project funded by the USDA Forest Service (PNW09-JV-11261900-003)....

This dataset represents the average C3 grass fraction (a biogeographic index based on the ratio of C3 to C4 grass) for each HUC5 watershed, simulated by the model MC1 for the 30-year period 1971-2000. Simulated mean C3 grass fraction was determined for each HUC5 watershed. Watersheds represent 5th level (HUC5, 10-digit) hydrologic unit boundaries and were acquired from the Natural Resources Conservation Service. Background: The dynamic global vegetation model MC1 (see Bachelet et al. 2001) was used to simulate vegetation dynamics, associated carbon and nitrogen cycle, water budget, and wild fire impacts for OR, WA, AZ and NM, for a project funded by the USDA Forest Service (PNW 09-JV-11261900-003). The MC1 model...
Categories: Publication;
Types: Citation;
Tags: Hydraulics,
Hydrologic,
Optimization,
Rio Bravo,
Rio Grande,
This dataset represents the average potential evaporation for each HUC5 watershed, simulated by the model MC1 for the 30-year period 1971-2000. Mean potential evaporation (in mm H2O yr-1), was determined for each HUC5 watershed by averaging values of original ~ 4 km raster data. Watersheds represent 5th level (HUC5, 10-digit) hydrologic unit boundaries and were acquired from the Natural Resources Conservation Service. Background: The dynamic global vegetation model MC1 (see Bachelet et al.2001) was used to simulate vegetation dynamics, associated carbon and nitrogen cycle, water budget, and wild fire impacts for OR, WA, AZ and NM, for a project funded by the USDA Forest Service (PNW09-JV-11261900-003). The...
For his MS thesis, Brendan Rogers used the vegetation model MC1 to simulate vegetation dynamics, associated carbon and nitrogen cycle, water budget and wild fire impacts across the western 2/3 of the states of Oregon and Washington using climate input data from the PRISM group (Chris Daly, OSU) at a 30arc second (800m) spatial grain. The model was run from 1895 to 2100 assuming that nitrogen demand from the plants was always met so that the nitrogen concentrations in various plant parts never dropped below their minimum reported values. A CO2 enhancement effect increased productivity and water use efficiency as the atmospheric CO2 concentration increased. Future climate change scenarios were generated through statistical...

This map represents the percent change in average annual precipitation, simulated by the model MC1 between the 30-year periods 1971-2000 and 2070-2099 under the Hadley climate change and A2 emissions scenarios. The average annual precipitation for the respective 30-year periods decreased in all of the 5,311 grid cells of the Apache-Sitgreaves study area. The greatest decrease was -25.1%; the least decrease was -9.2%; and the mean decrease was -15.8% The vegetation model MC1 (e.g. Bachelet et al. 2001) was used to simulate vegetation dynamics, associated carbon and nitrogen cycle, water budget, and wild fire impacts at two study sites in eastern Oregon (Deschutes and Fremont-Winema National Forests) and in Arizona...

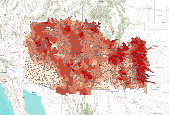
This map shows the predicted area of high fire potential for the current year up to the end of the forecast period as simulated by a modified version of the MC1 Dynamic General Vegetation Model (DGVM). Different colors indicate the level of consensus among five different MC1 simulations (i.e., one for each forecast provided by five different weather models), ranging from one of five to five of five simulations predicting high fire potential. The area of high fire potential is where PDSI and MC1-calculated values of potential fire behavior (fireline intensity for forest and shrubland and rate of spread of spread for grassland) exceed calibrated threshold values. Potential fire behavior in MC1 is estimated using...

Percent change in the average annual amount of live tree carbon for each HUC5 watershed between historical (1971-2000) and future (2071-2100) time periods. Data for the study site were simulated by the MC1 model under the CSIRO, MIROC, and Hadley climate change projections and the A2 anthropogenic emissions scenario.Mean live forest carbon (output variable C_Forestyr in MC1 version B60, which includes both above and below-ground tree carbon,) was determined for each HUC5 watershed. Watersheds represent 5th level (HUC5, 10-digit) hydrologic unit boundaries and were acquired from the Natural Resources Conservation Service. Units are grams per square meter, and percent change was calculated as (C_Forestyr(2071-2100)...
|

|
