Filters: Tags: solar radiation (X)
106 results (47ms)|
Filters
Date Range
Extensions Types Contacts
Categories Tag Types
|
The text file "PET.txt" contains hourly potential evapotranspiration (PET) data in thousandths of an inch from January 1, 1948, to September 30, 2017. Daily PET in thousandths of an inch is computed from average daily air temperature in degrees Fahrenheit (°F), average daily dewpoint temperature in degrees Fahrenheit (°F), daily total wind movement in miles (mi), and daily total solar radiation in Langleys per day (Lg/d) and disaggregated to hourly PET in thousandths of an inch using the Fortran program LXPET (Murphy, 2005). The primary source of the data is Argonne National Laboratory (Argonne National Laboratory, 2017) and is processed following the guidelines documented in Over and others (2010). References...
Watershed Data Management (WDM) database file ARGN21.WDM is an update of ARGN20.WDM (Bera, 2021) with the processed data from October 1, 2020 through September 30, 2021, appended to it. The primary data were downloaded from the Argonne National Laboratory (ANL) (Argonne National Laboratory, 2022) and processed following the guidelines documented in Over and others (2010). ARGN21.WDM file contains nine data series: air temperature, in degrees Fahrenheit (dsn 400), dewpoint temperature, in degrees Fahrenheit (dsn 500), wind speed, in miles per hour (dsn 300), solar radiation, in Langleys (dsn 600), computed potential evapotranspiration, in thousandths of an inch (dsn 200), and four data-source flag series for air...

These data were released prior to the October 1, 2016 effective date for the USGS’s policy dictating the review, approval, and release of scientific data as referenced in USGS Survey Manual Chapter 502.8 Fundamental Science Practices: Review and Approval of Scientific Data for Release. This spatial data set was created by the U.S. Geological Survey (USGS) to represent mean annual solar radiation in the Pacific Northwest region of the United States (Hydro Region 17; Major River Basin 7 (MRB7)) for the period between 1991 and 2005.
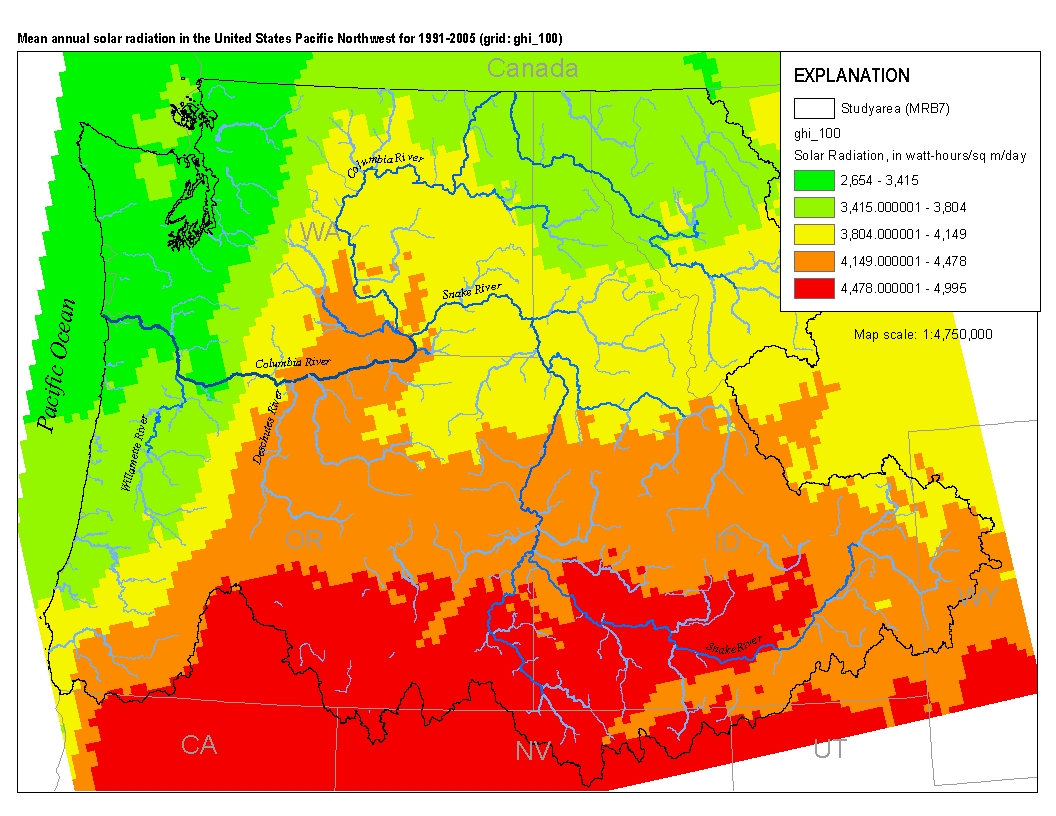
This spatial data set was created by the U.S. Geological Survey (USGS) to represent mean annual solar radiation in the Pacific Northwest region of the United States (Hydro Region 17; Major River Basin 7 (MRB7)) for the period between 1991 and 2005.
Solar radiation grids were produced for a set of large fires sampled from within the Great Northern Landscape Conservation Cooperative study area. This solar radiation grid was produced using the Area Solar Radiation tool in ArcGIS 10.1, using inputs of the associated 30m DEM.
Solar radiation grids were produced for a set of large fires sampled from within the Great Northern Landscape Conservation Cooperative study area. This solar radiation grid was produced using the Area Solar Radiation tool in ArcGIS 10.1, using inputs of the associated 30m DEM.
Solar radiation grids were produced for a set of large fires sampled from within the Great Northern Landscape Conservation Cooperative study area. This solar radiation grid was produced using the Area Solar Radiation tool in ArcGIS 10.1, using inputs of the associated 30m DEM.
Solar radiation grids were produced for a set of large fires sampled from within the Great Northern Landscape Conservation Cooperative study area. This solar radiation grid was produced using the Area Solar Radiation tool in ArcGIS 10.1, using inputs of the associated 30m DEM.
Solar radiation grids were produced for a set of large fires sampled from within the Great Northern Landscape Conservation Cooperative study area. This solar radiation grid was produced using the Area Solar Radiation tool in ArcGIS 10.1, using inputs of the associated 30m DEM.
A four-component (incoming and outgoing shortwave and longwave radiation) radiometer (model CNR1) was installed on a monitoring station (LZ40) constructed by the South Florida Water Management District (SFWMD) in the approximate center of Lake Okeechobee in Florida, located at 26 degrees 54 minutes 06.254 seconds North, 080 degrees 47 minutes 21.301 seconds West. Specific time-series collected for this data release include the following parameters with units of watts per square meter: (1) incoming shortwave radiation, (2) outgoing shortwave radiation, (3) incoming longwave radiation, and (4) outgoing longwave radiation. Instantaneous readings of each parameter were measured every 5 seconds and averaged over 15-minute...
Categories: Data;
Tags: Lake Okeechobee, Florida,
USGS Science Data Catalog (SDC),
long-wave radiation,
net radiation,
short-wave radiation,
Potential evapotranspiration (PET), and reference evapotranspiration (ETo) are estimated at an approximately 2-kilometer (approximately 0.019 degrees longitude and 0.018 degrees latitude) spatial grid and daily time-scale for the entire State of Florida. PET and ETo were computed on the basis of solar radiation, meteorological (minimum/maximum temperature, minimum/maximum relative humidity, and mean wind speed at 2-meter height), and shortwave blue-sky albedo data. Solar radiation was computed from Geostationary Operational Environmental Satellite (GOES) sensor data, blue-sky albedo was computed from the Moderate Resolution Imaging Spectrometer (MODIS) MCD43A1 BRDF/Albedo data product. Two versions of the dataset...
The Russian River Watershed (RRW) covers about 1,300 square miles (without Santa Rosa Plain) of urban, agricultural, and forested lands in northern Sonoma County and southern Mendocino County, California. Communities in the RRW depend on a combination of Russian River water and groundwater to meet their water-supply demands. Water is used primarily for agricultural irrigation, municipal and private wells supply, and commercial uses - such as for wineries and recreation. Annual rainfall in the RRW is highly variable, making it prone to droughts and flooding from atmospheric river events. In order to better understand surface-water and groundwater issues, the USGS is creating a Coupled Ground-Water and Surface-Water...
ARGN16.WDM contains nine data series: air temperature in degrees Fahrenheit (dsn 400), dewpoint temperature in degrees Fahrenheit (dsn 500), wind speed in miles per hour (dsn 300), solar radiation in Langleys (dsn 600), computed potential evapotranspiration in thousandths of an inch (dsn 200), and four data-source flag series for air temperature (dsn 410), dewpoint temperature (dsn 510), wind speed (dsn 310) and solar radiation (dsn 610) respectively from January 1,1948, to September 30, 2016. The primary source of the data is the Argonne National Laboratory, Illinois. To open this file user needs to install any of the utilities described in the section "The Related External Resources" in this page.
This text file "Solar radiation.txt" contains hourly data in Langleys and associated data-source flag from January 1, 1948, to September 30, 2016. The primary source of the data is the Argonne National Laboratory, Illinois. The data-source flag consist of a three-digit sequence in the form "xyz" that describe the origin and transformations of the data values. They indicate if the data are original or missing, the method that was used to fill the missing periods, and any other transformations of the data. Bera (2014) describes in detail an addition of a new data-source flag based on the regression analysis of the backup data series at St. Charles (STC) for water years (WY) 2008-10. The user of the data should consult...
The text file "PET.txt" contains the hourly data from January 1, 1948, to September 30, 2016. Daily potential evapotranspiration (PET) in thousandths of an inch is computed from average daily air temperature in degrees Fahrenheit (°F), average daily dewpoint temperature in degrees Fahrenheit (°F), daily total wind movement in miles (mi), and daily total solar radiation in Langleys per day (Lg/d) and disaggregated to hourly PET in thousandths of an inch using the Fortran program LXPET (Murphy, 2005). Reference Cited: Murphy, E.A., 2005, Comparison of potential evapotranspiration calculated by the LXPET (Lamoreux Potential Evapotranspiration) Program and by the WDMUtil (Watershed Data Management Utility) Program:...
ARGN17.WDM contains nine data series: air temperature in degrees Fahrenheit (dsn 400), dewpoint temperature in degrees Fahrenheit (dsn 500), wind speed in miles per hour (dsn 300), solar radiation in Langleys (dsn 600), computed potential evapotranspiration in thousandths of an inch (dsn 200), and four data-source flag series for air temperature (dsn 410), dewpoint temperature (dsn 510), wind speed (dsn 310) and solar radiation (dsn 610) respectively from January 1,1948, to September 30, 2017. The primary source of the data is Argonne National Laboratory (Argonne National Laboratory, 2017) and is processed following the guidelines documented in Over and others (2010). Daily potential evapotranspiration (PET) in...
Watershed Data Management (WDM) database file ARGN19.WDM is an update of ARGN18.WDM (Bera, 2019) with the processed data from October 1, 2018 through September 30, 2019, appended to it. The primary data were downloaded from the Argonne National Laboratory (ANL) (Argonne National Laboratory, 2019) and processed following the guidelines documented in Over and others (2010). ARGN19.WDM file contains nine data series: air temperature, in degrees Fahrenheit (dsn 400), dewpoint temperature, in degrees Fahrenheit (dsn 500), wind speed, in miles per hour (dsn 300), solar radiation, in Langleys (dsn 600), computed potential evapotranspiration, in thousandths of an inch (dsn 200), and four data-source flag series for air...
Solar radiation grids were produced for a set of large fires sampled from within the Great Northern Landscape Conservation Cooperative study area. This solar radiation grid was produced using the Area Solar Radiation tool in ArcGIS 10.1, using inputs of the associated 30m DEM.
Solar radiation grids were produced for a set of large fires sampled from within the Great Northern Landscape Conservation Cooperative study area. This solar radiation grid was produced using the Area Solar Radiation tool in ArcGIS 10.1, using inputs of the associated 30m DEM.
Categories: Data;
Types: Downloadable,
GeoTIFF,
Map Service,
Raster;
Tags: Fire,
GNLCC,
Solar Radiation,
Wildfire
PCIC's Regional Analysis Tool generates maps, plots and data describing projected future climate conditions for the Pacific and Yukon Region. It uses an ensemble of more than 15 Global Climate Model (GCM) and SRES emissions scenario combinations provided by the Intergovernmental Panel on Climate Change (IPCC). The Regional Analysis Tool allows you to: select from a set of predefined regions and generate maps, plots and data pertaining to that region for a specific time horizon (e.g., 2050s, 2080s, etc.) define your own custom region and generate maps, plots, and data pertaining to the area you specify generate maps showing projected changes for a specific region under one or more GCMs, with included grid boxes...
|

|
