Filters: Tags: streamflow (X)
915 results (62ms)|
Filters
Date Range
Extensions (Less)
Types (Less)
Contacts (Less)
Categories (Less)
Tag Types
|
The basis for these features is U.S. Geological Survey Scientific Investigations Report 2016-5105 Flood-inundation maps for the Peckman River in the Townships of Verona, Cedar Grove, and Little Falls, and the Borough of Woodland Park, New Jersey, 2014.Digital flood-inundation maps for an approximate 7.5-mile reach of the Peckman River in New Jersey, which extends from Verona Lake Dam in the Township of Verona downstream through the Township of Cedar Grove and the Township of Little Falls to the confluence with the Passaic River in the Borough of Woodland Park, were created by the U.S. Geological Survey (USGS) in cooperation with the New Jersey Department of Environmental Protection. Flood profiles were simulated...
Types: Map Service,
OGC WFS Layer,
OGC WMS Layer,
OGC WMS Service;
Tags: Floods,
Hydrology,
Inland Waters,
Little Falls,
New Jersey,
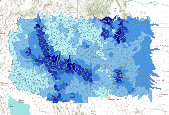
This landing page contains peak-flow frequency analyses by the U.S. Geological Survey Wyoming - Montana Water Science Center. Sets of analyses are published as data releases which are child items to this landing page.
The basis for these features is U.S. Geological Survey Scientific Investigations Report 2017-5024 Flood Inundation Mapping Data for Johnson Creek near Sycamore, Oregon. The domain of the HEC-RAS hydraulic model is a 12.9-mile reach of Johnson Creek from just upstream of SE 174th Avenue in Portland, Oregon, to its confluence with the Willamette River. Some of the hydraulics used in the model were taken from Federal Emergency Management Agency, 2010, Flood Insurance Study, City of Portland, Oregon, Multnomah, Clackamas, and Washington Counties, Volume 1 of 3, November 26, 2010. The Digital Elevation Model (DEM) utilized for the project was developed from lidar data flown in 2015 and provided by the Oregon Department...
Types: Citation;
Tags: Johnson Creek,
Portland, Oregon,
Willamette Valley,
digital elevation models,
floods,
The U.S. Geological Survey's (USGS) SPAtially Referenced Regression On Watershed attributes (SPARROW) model was used to aid in the interpretation of monitoring data and simulate streamflow and water-quality conditions in streams across the Pacific Region of the Unites States. SPARROW is a hybrid empirical/process-based mass balance model that can be used to estimate the major sources and environmental factors that affect the long-term supply, transport, and fate of contaminants in streams. The spatially explicit model structure is defined by a river reach network coupled with contributing catchments. The model is calibrated by statistically relating watershed sources and transport-related properties to monitoring-based...
The basis for these features is U.S. Geological Survey Scientific Investigations Report 2017-5024 Flood Inundation Mapping Data for Johnson Creek near Sycamore, Oregon. The domain of the HEC-RAS hydraulic model is a 12.9-mile reach of Johnson Creek from just upstream of SE 174th Avenue in Portland, Oregon, to its confluence with the Willamette River. Some of the hydraulics used in the model were taken from Federal Emergency Management Agency, 2010, Flood Insurance Study, City of Portland, Oregon, Multnomah, Clackamas, and Washington Counties, Volume 1 of 3, November 26, 2010. The Digital Elevation Model (DEM) utilized for the project was developed from lidar data flown in 2015 and provided by the Oregon Department...
Categories: Data;
Types: Citation,
Downloadable,
Map Service,
OGC WFS Layer,
OGC WMS Layer,
Shapefile;
Tags: Johnson Creek,
Portland, Oregon,
Willamette Valley,
digital elevation models,
floods,
This data set includes WRTDS nutrient flux trend results and the values of daily streamflow trend results displayed in the Quantile-Kendall plots. For 1995-2015 nutrient trends, the method of generalized flow normalization (FNG) was used which explicitly addresses non-stationary streamflow conditions. For 2005-2015 nutrient trends, the WRTDS trend analyses used the method of stationary flow normalization (FNS) because streamflow nonstationarity is difficult to assess over this shorter duration time frame. The 1995-2015 annual nutrient trends were determined for all five nutrient parameters (TP, SRP, TN, NO23, TKN), and monthly trends were evaluated only for SRP. The 2005-2015 annual nutrient trends were determined...
This dataset represents the average annual amount of water contributed to the stream network for each watershed, simulated by the model MC1 for the 30-year period 1971-2000. Simulated mean streamflow (stormflow + baseflow + runoff) was determined for each HUC5 watershed. Watersheds represent 5th level (HUC5, 10-digit) hydrologic unit boundaries and were acquired from the Natural Resources Conservation Service. Streamflow units are comparable to rainfall - millimeters of water per year. Background: The dynamic global vegetation model MC1 (see Bachelet et al. 2001) was used to simulate vegetation dynamics, associated carbon and nitrogen cycle, water budget, and wild fire impacts for OR, WA, AZ and NM, for a project...
Although surface water and groundwater are increasingly referred to as one resource, there remain environmental and ecosystem needs to study the 10 m to 1 km reach scale as one hydrologic system. Streams gain and lose water over a range of spatial and temporal scales. Large spatial scales (kilometers) have traditionally been recognized and studied as river-aquifer connections. Over the last 25 years hyporheic exchange flows (1–10 m) have been studied extensively. Often a transient storage model has been used to quantify the physical solute transport setting in which biogeochemical processes occur. At the longer 10 m to 1 km scale of stream reaches it is now clear that streams which gain water overall can coincidentally...
Categories: Publication;
Types: Citation;
Tags: Streamflow,
catchments,
hyporheic flow,
solute transport,
streams,
This data release contains inputs for and outputs from hydrologic simulations of the upper Chattahoochee River Basin in northeast Georgia using the Precipitation Runoff Modeling System (PRMS). These simulations were developed to provide example applications of enhancements to the PRMS for the following topics: two new time-series input options (dynamic parameter module and water-use module), two new output options (Hydrologic Response Unit (HRU) summary output module and basin variables summary output module), and three updates of existing capabilities (stream and lake flow routing module, surface-depression storage and flow simulation, and the initial-conditions specification). These PRMS model input and output...
Categories: Data;
Tags: Chattahoochee River,
USGS Science Data Catalog (SDC),
model,
streamflow,
streamflow modeling
The Apalachicola-Chattahoochee-Flint River Basin (ACFB) was modeled to produce fourteen simulations of streamflow for demonstration of enhancements to the Precipitation Runoff Modeling System (PRMS); seven simulations without water use effects and seven simulations with water use effects. The seven simulations without water use were for 1) the whole ACFB basin (1982-2012), 2) the Chestatee River sub-basin (1982-2012), 3) the Chipola River sub-basin (1982-2012), 4) the Ichawaynochaway Creek sub-basin (1982-2012), 5) the Potato Creek sub-basin (1942-2012), 6) the Spring Creek sub-basin (1952-2012), and 7) the upper Chattahoochee River sub-basin (1982-2012). The seven simulations with water use effects were for the...
Types: Citation;
Tags: Apalachicola River,
Chattahoochee River,
Chestatee River,
Chipola River,
Flint River,
The Fluvial Egg Drift Simulator (FluEgg) estimates bighead, silver, and grass carp egg and larval drift in rivers using species-specific egg developmental data combined with user-supplied hydraulic inputs (Garcia and others, 2013; Domanski, 2020). This data release contains results from 240 FluEgg 4.1.0 simulations of bighead carp eggs in the Illinois River under steady flow conditions. The data release also contains the hydraulic inputs used in the FluEgg simulations and a KML file of the centerline that represents the model domain. FluEgg simulations were run for all combinations of four spawning locations, six water temperatures, and ten steady flow conditions. Each simulation included 5,000 bighead carp eggs,...
This dataset contains an inventory of South Carolina U.S. Geological Survey (USGS) streamgages evaluated in 2017 as part of gage network gap assessment. Both continuous record and crest stage gages are included in this dataset. The data are grouped into three categories: rural streamgages with equal to or greater than 10 years of peak-flow data, rural streamgages with less than 10 years of peak-flow data, and urban streamgages.
Categories: Data;
Tags: South Carolina,
USGS Science Data Catalog (SDC),
environment,
floods and flood hazards,
geoscientificInformation,
The Wetland Reserve Program (WRP) is a voluntary program administered by the NRCS. It provides technical and financial assistance to private landowners and Tribes to restore, protect, and enhance wetlands in exchange for retiring eligible land from agriculture. For a site to be a wetland eligible for restoration, it must be in a zone with sustained or frequent flooding for a period of 7 consecutive days on average at least once every 2 years (a value termed the 7MQ2). This study calculated the 7MQ2 flows for all the U.S. Geological Survey streamgages within the selected study reaches. These flows were related to the stage discharge tables for each streamgage and a corresponding elevation was determined. By use of...
The USGS Wyoming-Montana Water Science Center (WY–MT WSC) completed a report (Sando and McCarthy, 2018) documenting methods for peak-flow frequency analysis following implementation of the Bulletin 17C guidelines. The methods are used to provide estimates of peak-flow quantiles for 50-, 42.9-, 20-, 10-, 4-, 2-, 1-, 0.5-, and 0.2-percent annual exceedance probabilities (AEPs) for selected streamgages operated by the WY–MT WSC. This data release presents peak-flow frequency analyses for 11 selected streamgages in Jefferson County, Montana, that were based on methods described by Sando and McCarthy (2018).
Categories: Data;
Types: Map Service,
OGC WFS Layer,
OGC WMS Layer,
OGC WMS Service;
Tags: Jefferson County,
Montana,
annual exceedance probability,
hydrology,
peak-flow frequency,
This file (wymt_ffa_2018D_WATSTORE.txt) contains peak flow data for peak-flow frequency analyses for selected streamgages in and near the Milk River Basin, Montana, based on data through water year 2018. The file is in a text format called WATSTORE (National Water Data Storage and Retrieval System) available from NWISWeb (http://nwis.waterdata.usgs.gov/usa/nwis/peak).
This data release contains daily time series estimates of natural streamflow at 5,439 GAGES-II non-reference streamgages in 19 study regions across the conterminous United States from October 1, 1980 through September 30, 2017, using five statistical techniques: nearest-neighbor drainage area ratio (NNDAR), map-correlation drainage area ratio (MCDAR), nearest-neighbor nonlinear spatial interpolation using flow duration curves (NNQPPQ), map-correlation nonlinear spatial interpolation using flow duration curves (MCQPPQ), and ordinary kriging of the logarithms of discharge per unit area (OKDAR). NNDAR, MCDAR, NNQPPQ, and MCQPPQ estimates were computed following methods described in Farmer and others (2014), with...
Categories: Data;
Tags: Conterminous United States,
USGS Science Data Catalog (SDC),
statistical analysis,
streamflow
The southeastern United States was modeled to produce 59 simulations of historical and potential future streamflow using the Precipitation Runoff Modeling System (PRMS) as part of the study documented in LaFontaine and others (2019). One simulation used historical observations of climate, 13 used historical climate simulations using statistically downscaled general circulation model (GCM) output from the Coupled Model Intercomparison Project (CMIP5), and 45 used potential future climate simulations using statistically downscaled CMIP5 GCMs for four representative concentration pathways. Historical simulations with observations are for the period 1952-2010, historical simulations with the GCMs are for the period...
A series of 11 digital flood-inundation maps were developed for a 5.5 mile reach of the lower Pawcatuck River in Westerly, Rhode Island and Stonington and North Stonington, Connecticut by the U.S. Geological Survey in cooperation with the Town of Westerly, Rhode Island and the Rhode Island Office of Housing and Community Development. The coverage of the maps extends from downstream from the Ashaway River inflow at the Westerly, Rhode Island and North Stonington, Connecticut State border to about 500 feet (ft) downstream of the U.S. Route 1/Broad Street bridge on the state border between Westerly, Rhode Island and Stonington, Connecticut. A hydraulic model was used to compute water-surface profiles for 11 flood stages...
Types: Citation;
Tags: Connecticut,
New London County,
North Stonington,
Pawcatuck River,
Rhode Island,
Regional regression equations were calculated in Puerto Rico with generalized least squares techniques to estimate flood frequency statistics at ungaged locations using drainage area as the only explanatory variable. The island was divided into 2 regions to minimize residuals. The region division that resulted in lower and more balanced residuals runs primarily north-south near the center of the island, mostly along an 8-digit hydrologic unit code (HUC8) boundary. The division line runs through a HUC8 polygon on the southern end of the island, but care was taken to include entire watersheds and consideration was given where hydrologic and physiographic properties differed. This data release includes geographic information...
Types: Map Service,
OGC WFS Layer,
OGC WMS Layer,
OGC WMS Service;
Tags: HUC,
Puerto Rico,
WBD,
Watershed,
Watershed Boundary Dataset,
The U.S. Geological Survey (USGS), in cooperation with the Puerto Rico Environmental Quality Board, has compiled a series of geospatial datasets for Puerto Rico to be implemented into the USGS StreamStats application (https://streamstats.usgs.gov/ss/). These geospatial datasets, along with basin characteristics datasets for Puerto Rico published as a separate USGS data release (https://doi.org/10.5066/P9HK9SSQ), were used to delineate watersheds and develop the peak-flow and low-flow regression equations used by StreamStats. The geospatial dataset described herein are the sink watershed grid rasters at a 10-m resolution. A value is assigned to pixels in each sink watershed and the count of cells that drain to that...
Categories: Data;
Types: Downloadable,
GeoTIFF,
Map Service,
Raster;
Tags: Puerto Rico,
Puerto Rico,
U.S. possessions and associated areas,
environment,
geoscientificInformation,
|

|
