Filters: Tags: washington (X) > partyWithName: U.S. Geological Survey (X)
16,078 results (87ms)|
Filters
Date Range
Extensions
Types Contacts
Categories
Tag Types
|
Development of oil and gas wells leads to the destruction and fragmentation of natural habitat. Oil and gas wells also increase noise levels which has been shown to be detrimental to some wildlife species. Therefore, the density of oil and gas wells in the western United States was modeled based on data obtained from the National Oil and Gas Assessment.
Categories: Data;
Types: Downloadable,
GeoTIFF,
Map Service,
Raster;
Tags: Arizona,
California,
Colorado,
Conservation Assessment,
Idaho,
This data set depicts soil characteristics in western North America. The data set was created from NRCS STATSGO soil data. Calculations were made to reduce one to many relationships to one to one relationships in order to summarize average water capacity, depth to rock, salinity, and pH for each map unit (MUID). ArcMap 8.3 was used to import .dbf files and merge newly created attribute fields to the GIS soil coverage.
Field spikes were prepared at 207 stream and river sites as part of the U.S. Geological Survey (USGS) National Water Quality Assessment (NAWQA) project between December, 2012, and September, 2015. At the field site, a depth-and width-integrated environmental sample was collected, and one subsample of the environmental sample was spiked with a known amount of a spike mixture. Both the spiked subsample ("spike sample") and another subsample ("environmental sample") of the original water sample were analyzed for pesticides at the USGS National Water Quality Laboratory (NWQL) by direct injection liquid chromatography with tandem mass spectrometry (LC-MS/MS), and were used to calculate the spike recovery of each analyte....
Layers of geospatial data include contours, boundaries, land cover, hydrography, roads, transportation, geographic names, structures, and other selected map features.
Types: Citation;
Tags: 7.5 x 7.5 minute,
7.5 x 7.5 minute,
Combined Vector,
Combined Vector,
Combined Vector,

This map layer consists of federally owned or administered lands of the United States, Puerto Rico, and the U.S. Virgin Islands. For the most part, only areas of 320 acres or more are included; some smaller areas deemed to be important or significant are also included. There may be private inholdings within the boundaries of Federal lands in this map layer. Some established Federal lands which are larger than 320 acres are not included in this map layer, because their boundaries were not available from the owning or administering agency.
Layers of geospatial data include contours, boundaries, land cover, hydrography, roads, transportation, geographic names, structures, and other selected map features.
Types: Citation;
Tags: 7.5 x 7.5 minute,
7.5 x 7.5 minute,
Asotin County,
Combined Vector,
Combined Vector,
A one-year seismic hazard forecast for the Central and Eastern United States, based on induced and natural earthquakes, has been produced by the U.S. Geological Survey. The model assumes that earthquake rates calculated from several different time windows will remain relatively stationary and can be used to forecast earthquake hazard and damage intensity for the year 2016. This assessment is the first step in developing an operational earthquake forecast for the CEUS, and the analysis could be revised with updated seismicity and model parameters. Consensus input models consider alternative earthquake catalog durations, smoothing parameters, maximum magnitudes, and ground motion estimates, and represent uncertainties...
Categories: Data;
Types: Downloadable,
GeoTIFF,
Map Service,
Raster;
Tags: Arizona,
California,
Colorado,
Earthquake,
Hazard,
All roads in the western United States from the 2000 US Census Bureau 1:100,000 scale TIGER/line files.
Categories: Data;
Types: Downloadable,
Map Service,
OGC WFS Layer,
OGC WMS Layer,
Shapefile;
Tags: Arizona,
California,
Census 2000,
Colorado,
Idaho,
Locations of railroad lines for 11 western states. The Bureau of Transportation Statistics 1:100k Railroads line network was clipped to the boundary of the 11 Western States.
Map containing historical census data from 1900 - 2000 throughout the western United States at the county level. Data includes total population, population density, and percent population change by decade for each county. Population data was obtained from the US Census Bureau and joined to 1:2,000,000 scale National Atlas counties shapefile.
Categories: Data;
Types: Downloadable,
Map Service,
OGC WFS Layer,
OGC WMS Layer,
Shapefile;
Tags: Arizona,
California,
Colorado,
Idaho,
Montana,
Layered GeoPDF 7.5 Minute Quadrangle Map. Layers of geospatial data include orthoimagery, roads, grids, geographic names, elevation contours, hydrography, and other selected map features.
The U.S. Geological Survey (USGS) has been engaged in airborne electromagnetics (AEM) since the 1970s, playing a role in the development of early acquisition systems, developing calibration methods, refining standards for data acquisition, improving data processing, modeling, and interpretation methods, and expanding the range of AEM applications. However, USGS AEM survey visibility and data accessibility has not advanced as rapidly as our use of the technique. This data release catalogs AEM surveys in the United States that have contributed to studies under USGS programs including Water, Geologic Mapping, Minerals, Energy, Environmental Health, Ecosystems, Hazards, and Climate. This dataset contains locations for...
Categories: Data;
Types: ArcGIS REST Map Service,
ArcGIS Service Definition,
Downloadable,
Map Service;
Tags: Alabama,
Arizona,
Arkansas,
California,
Colorado,
Layered GeoPDF 7.5 Minute Quadrangle Map. Layers of geospatial data include orthoimagery, roads, grids, geographic names, elevation contours, hydrography, and other selected map features.
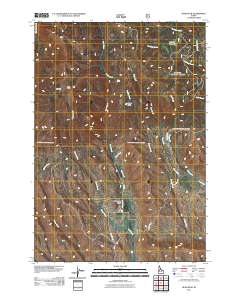
Layered GeoPDF 7.5 Minute Quadrangle Map. Layers of geospatial data include orthoimagery, roads, grids, geographic names, elevation contours, hydrography, and other selected map features.
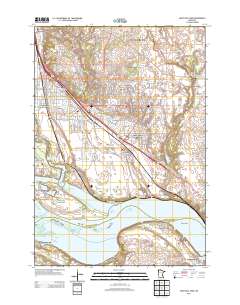
Layered GeoPDF 7.5 Minute Quadrangle Map. Layers of geospatial data include orthoimagery, roads, grids, geographic names, elevation contours, hydrography, and other selected map features.
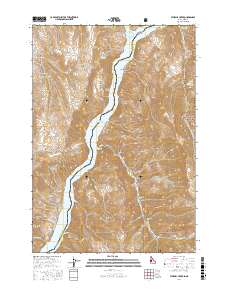
Layered geospatial PDF Map. Layers of geospatial data include orthoimagery, roads, grids, geographic names, elevation contours, hydrography, and other selected map features.
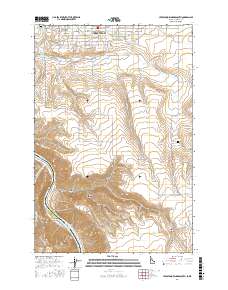
Layered geospatial PDF Map. Layers of geospatial data include orthoimagery, roads, grids, geographic names, elevation contours, hydrography, and other selected map features.
Layered geospatial PDF Map. Layers of geospatial data include orthoimagery, roads, grids, geographic names, elevation contours, hydrography, and other selected map features.
Layered GeoPDF 7.5 Minute Quadrangle Map. Layers of geospatial data include orthoimagery, roads, grids, geographic names, elevation contours, hydrography, and other selected map features.
Layered GeoPDF 7.5 Minute Quadrangle Map. Layers of geospatial data include orthoimagery, roads, grids, geographic names, elevation contours, hydrography, and other selected map features.
|

|
