Filters: Tags: water level (X)
150 results (53ms)|
Filters
Date Range
Extensions Types
Contacts
Categories Tag Types
|
These data were released prior to the October 1, 2016 effective date for the USGS’s policy dictating the review, approval, and release of scientific data as referenced in USGS Survey Manual Chapter 502.8 Fundamental Science Practices: Review and Approval of Scientific Data for Release. This data set describes wells (excluding observation wells) that are completed in the Arikaree aquifer and that were used to create a map of the generalized potentiometric surface of the Arikaree aquifer in the Pine Ridge Indian Reservation and Bennett County. Water levels in the wells were measured by a variety of people including the well drillers and U.S. Geological Survey personnel. The water-level data for this data set are...
Categories: pre-SM502.8;
Tags: Arikaree aquifer,
Bennett County,
Jackson County,
NSDI,
Pine Ridge Indian Reservation,

These data were released prior to the October 1, 2016 effective date for the USGS’s policy dictating the review, approval, and release of scientific data as referenced in USGS Survey Manual Chapter 502.8 Fundamental Science Practices: Review and Approval of Scientific Data for Release. This digital data set defines the subregions of the transient ground-water flow model of the Death Valley regional ground-water flow system (DVRFS). Subregions are used to more readily describe and evaluate the source, occurrence, and movement of ground water within and between the smaller areas of the DVRFS, which is an approximately 45,000 square- kilometer region of southern Nevada and California. The subregions, first described...
Categories: pre-SM502.8;
Tags: Amargosa Desert,
Ash Meadows,
California,
California Valley,
Chicago Valley,

These data were released prior to the October 1, 2016 effective date for the USGS’s policy dictating the review, approval, and release of scientific data as referenced in USGS Survey Manual Chapter 502.8 Fundamental Science Practices: Review and Approval of Scientific Data for Release. A natural consequence of groundwater withdrawals is the removal of water from subsurface storage, but the overall rates and magnitude of groundwater depletion in the United States are not well characterized. This study evaluates long-term cumulative depletion volumes in 40 separate aquifers or areas and one land use category in the United States, bringing together information from the literature and from new analyses. Depletion is...

These data were released prior to the October 1, 2016 effective date for the USGS’s policy dictating the review, approval, and release of scientific data as referenced in USGS Survey Manual Chapter 502.8 Fundamental Science Practices: Review and Approval of Scientific Data for Release. The USGS compiles online access to water-resources data collected at approximately 1.5 million sites in all 50 States, the District of Columbia, Puerto Rico, the Virgin Islands, Guam, American Samoa and the Commonwealth of the Northern Mariana Islands.
We developed the HyCReWW metamodel to predict wave run-up under a wide range of coral reef morphometric and offshore forcing characteristics. Due to the complexity and high dimensionality of the problem, we assumed an idealized one-dimensional reef profile, characterized by seven primary parameters. XBeach Non-Hydrostatic was chosen to create the synthetic dataset and Radial Basis Functions implemented in Matlab were chosen for interpolation. Results demonstrate the applicability of the metamodel to obtain fast and accurate results of wave run-up for a large range of intrinsic coral reef morphologic and extrinsic hydrodynamic forcing parameters, offering a useful tool for risk management and early warning systems....
The purpose of this data release is to present well location and construction data for select wells representing the water table in eastern Albuquerque and the selected groundwater-level measurements at the wells from the winters of 2008 and 2016. Construction and groundwater-level measurement data include screening intervals at the water table, reference elevation, depth to water in feet and elevation, measurement data, and latitude and longitude. Well data have been collected from the USGS Groundwater Site Inventory, Kirtland Air Force Base, AECOM, Sandia National Laboratory, and the City of Albuquerque. This data release contains files of the data from 2008, the data from 2016, the data from sites with measurements...
Categories: Data;
Tags: Albuquerque,
Bernalillo County,
Hydrology,
Kirtland Air Force Base,
New Mexico,
Thirteen geospatial datasets were developed to characterize the shallow groundwater system in the Lower Gunnison River Basin, Colorado. These geospatial datasets provide information about regolith thickness and altitude of the bedrock surface underlying regolith and display, in vector and raster formats, the generalized extent and thickness of regolith sediments that comprise the shallow groundwater system in the Lower Gunnison River Basin; display, in raster and vector format, the generalized altitude and configuration of the bedrock surface that comprises the base of the shallow groundwater system in the Lower Gunnison River Basin; provide information about depth to water, altitude of the potentiometric surface,...
Categories: Data;
Types: Downloadable,
Map Service,
OGC WFS Layer,
OGC WMS Layer,
Shapefile;
Tags: Colorado,
Delta,
Gunnison,
Hydrogeology,
Montrose, Colo.,
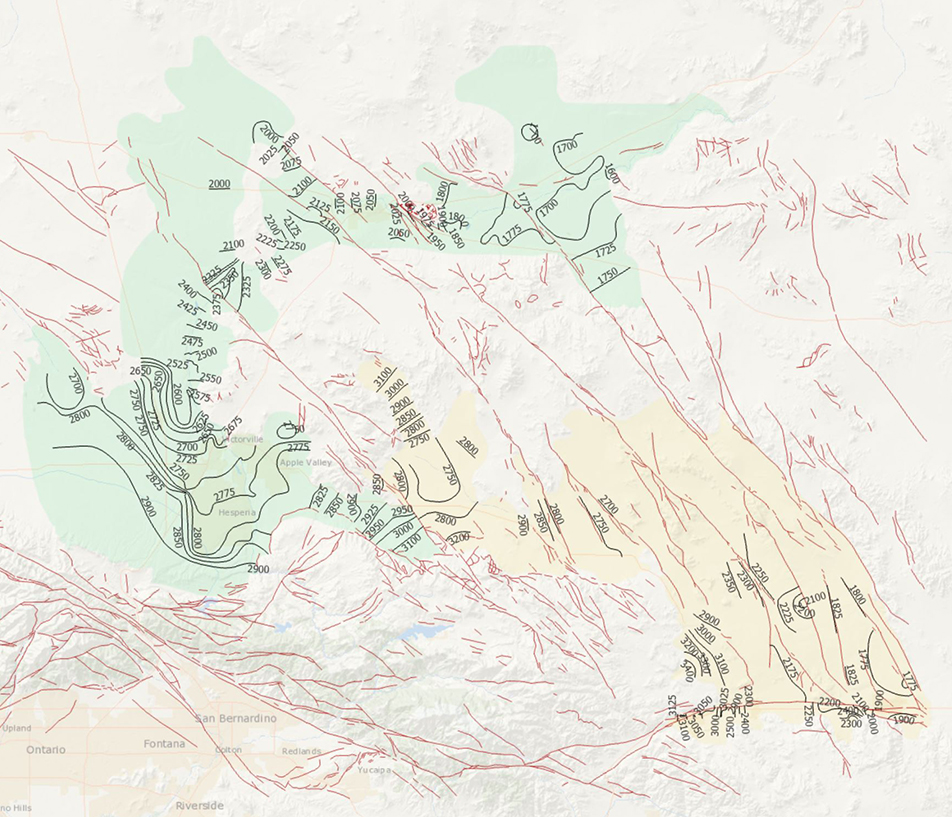
During 2014, the U.S. Geological Survey and other agencies made approximately 1,026 water-level measurements in the Mojave River and Morongo groundwater basins. These data document recent conditions and, when compared with previous data, changes in groundwater levels. A water-level contour map was drawn using data from about 610 wells, providing coverage for most of the basins. Twenty-four hydrographs show long-term (1930-2014) water-level conditions throughout the basins, and 9 short-term (1992 to 2014) hydrographs show the effects of recharge and discharge along the Mojave River. In addition, a water-level-change map was compiled to compare was compiled to compare the 2014 water levels to the 2012 water levels...
Categories: Data Release - Revised;
Tags: USGS,
USGS Science Data Catalog (SDC),
contours,
drainage basin,
ground water,
This data release (version 1.0, August 2018) consists of two files, a Microsoft® Access database and Microsoft® Excel workbook, that contain water levels collected from 1941 to 2017 and other hydrologic information for 904 wells in and near areas of underground nuclear testing at the Nevada Test Site. Data and information in the database and workbook have been updated and are superseded by version 2.0 (December 2018) of the data release.
The U.S. Geological Survey (USGS) is providing online maps of water-table and potentiometric-surface altitude in the upper glacial, Magothy, Jameco, Lloyd, and North Shore aquifers on Long Island, New York, April–May 2016. Also provided is a depth-to-water map for Long Island, New York, April–May 2016. The USGS makes these maps and geospatial data available as REST Open Map Services (as well as HTTP, JSON, KML, and shapefile), so end-users can consume them on mobile and web clients. A companion report, U.S. Geological Survey Scientific Investigations Map 3398 (Como and others, 2018; https://doi.org/10.3133/sim3398) further describes data collection and map preparation and presents 68x22 in. Portable Document...
Categories: Data;
Types: ArcGIS REST Map Service,
ArcGIS Service Definition,
Citation,
Downloadable,
Map Service;
Tags: Contours,
Groundwater,
Hydrology,
Jameco Aquifer,
Levels,
The U.S. Geological Survey (USGS) is providing an online map of potentiometric-surface altitude contours in the Magothy and Jameco aquifers on Long Island, New York, April-May 2013. USGS serves this map and geospatial data as a REST Open Map Service (as well as HTTP, JSON, KML, and shapefile), so end-users can use the map and data on mobile and web clients. A companion report, U.S. Geological Survey Scientific Investigations Map 3326 (Como and others, 2015; http://dx.doi.org/10.3133/sim3326) further describes data collection and map preparation and presents 68x22 in. PDF versions, 4 sheets, scale 1:125,000. This polyline shapefile consists of digital contours that represent the potentiometric-surface...
Categories: Data,
Publication;
Types: ArcGIS REST Map Service,
ArcGIS Service Definition,
Citation,
Downloadable,
Map Service;
Tags: Contours,
Contours,
Geospatial Applications,
Groundwater,
Groundwater,
This dataset contains records of water level and water temperature measurements from select wetlands at Saint Marks National Wildlife Refuge. These data were collected as part of the U.S. Geological Survey (USGS) Amphibian Research and Monitoring Initiative (ARMI). Beginning in July 2010, hydrologic monitoring equipment was installed in 24 wetlands. Instrumentation included a staff gage and a non-vented continuous logging pressure transducer (Onset Comp U20) that logged data at 1-hour intervals. An additional 35 sites were instrumented in January 2014. Data for individual wetlands covers different time periods based on different phases of studies and sensor battery failures. In shallow, ephemeral wetlands these...
Categories: Data;
Types: Citation;
Tags: Florida,
Geographically isolated wetlands,
Saint Marks National Wildlife Refuge,
Wakulla,
hydroperiod,
This data release includes the XBeach input data files used to evaluate the importance of explicitly modeling sea-swell waves for runup. This was examined using a 2D XBeach short wave-averaged (surfbeat, XB-SB) and a wave-resolving (non-hydrostatic, XB-NH) model of Roi-Namur Island on Kwajalein Atoll in the Republic of Marshall Islands. Results show that explicitly modelling the sea-swell component (using XB-NH) provides a better approximation of the observed runup than XB-SB (which only models the time-variation of the sea-swell wave height), despite good model performance of both models on reef flat water levels and wave heights. However, both models under-predict runup peaks. The difference between XB-SB and...
Using global climate model projections of sea-surface temperature at coral reef sites, we modeled the effects of depth and exposure to semidiurnal temperature fluctuations to examine how these effects may alter the projected year of annual severe bleaching for coral reef sites globally. Here we present the first global maps of the effects these processes have on bleaching projections for three IPCC-AR5 emissions scenarios.

These data were released prior to the October 1, 2016 effective date for the USGS’s policy dictating the review, approval, and release of scientific data as referenced in USGS Survey Manual Chapter 502.8 Fundamental Science Practices: Review and Approval of Scientific Data for Release. This digital geospatial data set is a compilation of reference points representing springs in Nevada that were used for the regional ground-water potential map by Bedinger and Harrill (2004). The regional ground-water potential map was developed to assess potential interbasin flow in the Death Valley regional ground-water flow system (DVRFS), a 100,000 square-kilometer region of southern Nevada and California. To obtain an adequate...
Categories: pre-SM502.8;
Tags: Amargosa Desert,
Ash Meadows,
California,
California Valley,
Chicago Valley,
These data were released prior to the October 1, 2016 effective date for the USGS’s policy dictating the review, approval, and release of scientific data as referenced in USGS Survey Manual Chapter 502.8 Fundamental Science Practices: Review and Approval of Scientific Data for Release. This map shows specific water-quality items and hydrologic data site information which come from QWDATA (Water Quality) and GWSI (Ground Water Information System). Both QWDATA and GWSI are subsystems of NWIS (National Water Inventory System)of the USGS (United States Geologic Survey). This map is for Wasatch County, Utah. The scope and purpose of NWIS is defined on the web site: http://water.usgs.gov/public/pubs/FS/FS-027-98/

These data were released prior to the October 1, 2016 effective date for the USGS’s policy dictating the review, approval, and release of scientific data as referenced in USGS Survey Manual Chapter 502.8 Fundamental Science Practices: Review and Approval of Scientific Data for Release. This dataset describes wells completed in the Inyan Kara Group that were used to create a potentiometric surface for the Inyan Kara aquifer.
Categories: pre-SM502.8;
Tags: Black Hills,
Inyan Kara Group,
Inyan Kara aquifer,
NSDI,
South Dakota,
These data were released prior to the October 1, 2016 effective date for the USGS’s policy dictating the review, approval, and release of scientific data as referenced in USGS Survey Manual Chapter 502.8 Fundamental Science Practices: Review and Approval of Scientific Data for Release. This data set describes observation wells completed in the Arikaree aquifer that were used to create a map of the generalized potentiometric surface of the Arikaree aquifer in the Pine Ridge Indian Reservation and Bennett County. The observation wells are owned by the South Dakota Department of Environment and Natural Resources. Water levels in the wells were measured by staff of the South Dakota Department of Environment and Natural...
Categories: pre-SM502.8;
Tags: Arikaree aquifer,
Bennett County,
Jackson County,
NSDI,
Pine Ridge Indian Reservation,

These data were released prior to the October 1, 2016 effective date for the USGS’s policy dictating the review, approval, and release of scientific data as referenced in USGS Survey Manual Chapter 502.8 Fundamental Science Practices: Review and Approval of Scientific Data for Release. The USGS compiles online access to water-resources data collected at approximately 1.5 million sites in all 50 States, the District of Columbia, Puerto Rico, the Virgin Islands, Guam, American Samoa and the Commonwealth of the Northern Mariana Islands.

These data were released prior to the October 1, 2016 effective date for the USGS’s policy dictating the review, approval, and release of scientific data as referenced in USGS Survey Manual Chapter 502.8 Fundamental Science Practices: Review and Approval of Scientific Data for Release. The U.S. Geological Survey's National Water-Use Information Program is responsible for compiling and disseminating the nation's water-use data. The USGS works in cooperation with local, State, and Federal environmental agencies to collect water-use information. USGS compiles these data to produce water-use information aggregated at the county, state, and national levels. Every five years, data at the county level are compiled into...
|

|
