Filters: Tags: watersheds (X) > partyWithName: Conservation Biology Institute (X)
53 results (131ms)|
Filters
|

This dataset represents the average amount of soil carbon within each HUC5 watershed, simulated by the model MC1 for the 30-year period 1971-2000. Soil carbon, in g m-2, was determined for each HUC5 watershed. Watersheds represent 5th level (HUC5, 10-digit) hydrologic unit boundaries and were acquired from the Natural Resources Conservation Service. Background: The dynamic global vegetation model MC1 (see Bachelet et al.2001) was used to simulate vegetation dynamics, associated carbon and nitrogen cycle, water budget, and wild fire impacts for OR, WA, AZ and NM, for a project funded by the USDA Forest Service (PNW09-JV-11261900-003). The MC1 model was run using historical data and future climate change projections...
This dataset represents the average net primary production for each HUC5 watershed, simulated by the model MC1 for the 30-year period 1971-2000. Mean net primary production (in g m-2 per yr), was determined for each HUC5 watershed by averaging values of original ~ 4 km raster data. Watersheds represent 5th level (HUC5, 10-digit) hydrologic unit boundaries and were acquired from the Natural Resources Conservation Service. Background: The dynamic global vegetation model MC1 (see Bachelet et al.2001) was used to simulate vegetation dynamics, associated carbon and nitrogen cycle, water budget, and wild fire impacts for OR, WA, AZ and NM, for a project funded by the USDA Forest Service (PNW09-JV-11261900-003). The MC1...

These data were provided by Dudek, for full metadata please contact them directly. Layer description from Appendix A: The California Interagency Watershed Map of 1999 (updated May 2004, "calw221") is the State of California's working definition of watershed boundaries. Previous Calwater versions (1.2 and 2.2) described California watersheds, beginning with the division of the State's 101 million acres into ten Hydrologic Regions (HR). Each HR is progressively subdivided into six smaller, nested levels: the Hydrologic Unit (HU, major rivers), Hydrologic Area (HA, major tributaries), Hydrologic Sub-Area (HSA), Super Planning Watershed (SPWS), and Planning Watershed (PWS). At the Planning Watershed (the most detailed...

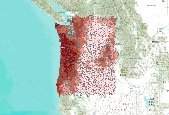
Percent change in the average surface runoff for each HUC5 watershed between historical (1971-2000) and future (2071-2100) time periods. The MC1 dynamic vegetation model was run under the CSIRO, MIROC, and Hadley climate change projections and the A2 anthropogenic emissions scenario.Simulated mean annual surface runoff (in mm H2O yr-1), was determined for each HUC5 watershed by averaging values of original ~ 4 km raster data. Watersheds represent 5th level (HUC5, 10-digit) hydrologic unit boundaries and were acquired from the Natural Resources Conservation Service. Background: The dynamic global vegetation model MC1 (see Bachelet et al. 2001) was used to simulate vegetation dynamics, associated carbon and nitrogen...

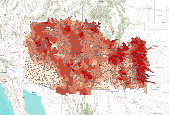
Percent change in the mean area burned per year (per ~4 km pixel ) for each HUC5 watershed between historical (1971-2000) and future (2071-2100) time periods. The MC1 dynamic vegetation model was run under the CSIRO, MIROC, and Hadley climate change projections and the A2 anthropogenic emissions scenario.Mean area burned per year per ~4 km pixel, (in square meters), was determined for each HUC5 watershed. Watersheds represent 5th level (HUC5, 10-digit) hydrologic unit boundaries and were acquired from the Natural Resources Conservation Service. Background: The dynamic global vegetation model MC1 (see Bachelet et al. 2001) was used to simulate vegetation dynamics, associated carbon and nitrogen cycle, water budget,...

This dataset depicts watershed boundaries for St. Thomas and St. John, US Virgin Islands.
This dataset represents the average amount of Growing Degree Days (GDD) per year within each HUC5 watershed, simulated by the model MC1 for the 30-year period 1971-2000. Growing degree days (referenced to 0oC) (unit = deg C days) were determined for each HUC5 watershed. Watersheds represent 5th level (HUC5, 10-digit) hydrologic unit boundaries. They were acquired from the Natural Resources Conservation Service. Background: The dynamic global vegetation model MC1 (see Bachelet et al. 2001) was used to simulate vegetation dynamics, associated carbon and nitrogen cycle, water budget, and wild fire impacts for OR, WA, AZ and NM, for a project funded by the USDA Forest Service (PNW 09-JV-11261900-003). The MC1 model...

This dataset represents the average net primary production for each HUC5 watershed, simulated by the model MC1 for the 30-year period 1971-2000. Mean net primary production (in g m-2 per yr), was determined for each HUC5 watershed by averaging values of original ~ 4 km raster data. Watersheds represent 5th level (HUC5, 10-digit) hydrologic unit boundaries and were acquired from the Natural Resources Conservation Service. Background: The dynamic global vegetation model MC1 (see Bachelet et al.2001) was used to simulate vegetation dynamics, associated carbon and nitrogen cycle, water budget, and wild fire impacts for OR, WA, AZ and NM, for a project funded by the USDA Forest Service (PNW09-JV-11261900-003). The...

This dataset was derived from the Freshwater Ecoregions of the World dataset by Paulo Petry. The Falkland Islands were separated from Patagonia during an edit session. Freshwater Ecoregions of the World, (FEOW) provides a new global biogeographic regionalization of the Earth's freshwater biodiversity. Covering virtually all freshwater habitats on Earth, this first-ever ecoregion map, together with associated species data, is a useful tool for underpinning global and regional conservation planning efforts, particularly to identify outstanding and imperiled freshwater systems; for serving as a logical framework for large-scale conservation strategies; and for providing a global-scale knowledge base for increasing...
Tags: drainage basins,
watersheds

In 2006, TNC sought to develop a classification of watershed units to be used in conservation planning and conservation measures benchmarks in South America. The objectives of this project were to: Map freshwater ecological systems at a continental scale for priority setting and conservation strategy planning, build freshwater-related datasets for reference and to have a standardized dataset to perform analysis and perform parallel analyses related to threats assessments, protected area gap analyses and other applications. The process that we followed aimed to replicate the classification methodology proposed by Higgins et al, 2005 (Figure 1). Using this hierarchical classification system, large classification...
Tags: freahwater ecosystems,
watersheds
This dataset represents the historical mean annual area burned per ~ 4 km pixel, averaged for each HUC5 watershed, simulated by the model MC1 for the 30-year period 1971-2000. Historical mean area burned per year (in square meters) per ~4 km pixel was averaged across each HUC5 watershed. Watersheds represent 5th level (HUC5, 10-digit) hydrologic unit boundaries and were acquired from the Natural Resources Conservation Service. Background: The dynamic global vegetation model MC1 (see Bachelet et al.2001) was used to simulate vegetation dynamics, associated carbon and nitrogen cycle, water budget, and wild fire impacts for OR, WA, AZ and NM, for a project funded by the USDA Forest Service (PNW09-JV-11261900-003)....

This dataset represents the average maximum annual value of total vegetation carbon for each HUC5 watershed, simulated by the model MC1 for the 30-year period 1971-2000. Mean maximum annual value of total vegetation carbon in g m-2, was determined for each HUC5 watershed. Watersheds represent 5th level (HUC5, 10-digit) hydrologic unit boundaries and were acquired from the Natural Resources Conservation Service. Background: The dynamic global vegetation model MC1 (see Bachelet et al.2001) was used to simulate vegetation dynamics, associated carbon and nitrogen cycle, water budget, and wild fire impacts for OR, WA, AZ and NM, for a project funded by the USDA Forest Service (PNW09-JV-11261900-003). The MC1 model was...

Percent change in Growing Degree Days (GDD) for each HUC5 watershed between historical (1971-2000) and future (2071-2100) time periods. The MC1 dynamic vegetation model was run under the CSIRO, MIROC, and Hadley climate change projections and the A2 anthropogenic emissions scenario. Growing degree days (referenced to 0oC) (unit = deg C days) were determined for each HUC5 watershed. Watersheds represent 5th level (HUC5, 10-digit) hydrologic unit boundaries. They were acquired from the Natural Resources Conservation Service. Background: The dynamic global vegetation model MC1 (see Bachelet et al. 2001) was used to simulate vegetation dynamics, associated carbon and nitrogen cycle, water budget, and wild fire impacts...
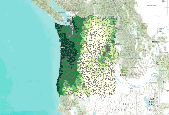
This dataset represents the historical majority vegetation type (30 year mode), for each HUC5 watershed, simulated by the model MC1 for the 30-year period 1971-2000. Majority vegetation type was determined for each HUC5 watershed by calculating the 30 year mode from original ~ 4 km raster data. Watersheds represent 5th level (HUC5, 10-digit) hydrologic unit boundaries and were acquired from the Natural Resources Conservation Service. Background: The dynamic global vegetation model MC1 (see Bachelet et al.2001) was used to simulate vegetation dynamics, associated carbon and nitrogen cycle, water budget, a nd wild fire impacts for OR, WA, AZ and NM, for a project funded by the USDA Forest Service (PNW09-JV-11261900-003)....

Percent change in the average potential evaporation for each HUC5 watershed between historical (1971-2000) and future (2071-2100) time periods. The MC1 dynamic vegetation model was run under the CSIRO, MIROC, and Hadley climate change projections and the A2 anthropogenic emissions scenario. Simulated mean potential evaporation (in mm H2O yr-1), was determined for each HUC5 watershed by averaging values of original ~ 4 km raster data. Watersheds represent 5th level (HUC5, 10-digit) hydrologic unit boundaries and were acquired from the Natural Resources Conservation Service. Background: The dynamic global vegetation model MC1 (see Bachelet et al. 2001) was used to simulate vegetation dynamics, associated carbon and...

This dataset depicts watersheds of Belize. According to Hipolito Contreras of the Belize Land Information Centre (personal communication 2005), the watersheds of Belize coverage is one of a few base layers developed by the U.K. Directorate of Overseas Surveys (DOS), based on the 1:50,000 OS topographic sheets and deposited directly at the Land Information Centre (LIC) at its inception in 1992. The version presented here was made public through release of this dataset to the CCAD - the Central American Commission on Environment & Development.

Percent change in the average net primary production for each HUC5 watershed between historical (1971-2000) and future (2071-2100) time periods. The MC1 dynamic vegetation model was run under the CSIRO, MIROC, and Hadley climate change projections and the A2 anthropogenic emissions scenario. Simulated mean net primary production (in g m-2 per yr), was determined for each HUC5 watershed by averaging values of original ~ 4 km raster data. Watersheds represent 5th level (HUC5, 10-digit) hydrologic unit boundaries and were acquired from the Natural Resources Conservation Service. Background: The dynamic global vegetation model MC1 (see Bachelet et al. 2001) was used to simulate vegetation dynamics, associated carbon...

This dataset represents the average amount of Growing Degree Days (GDD) per year within each HUC5 watershed, simulated by the model MC1 for the 30-year period 1971-2000. Growing degree days (referenced to 0oC) (unit = deg C days) were determined for each HUC5 watershed. Watersheds represent 5th level (HUC5, 10-digit) hydrologic unit boundaries. They were acquired from the Natural Resources Conservation Service. Background: The dynamic global vegetation model MC1 (see Bachelet et al. 2001) was used to simulate vegetation dynamics, associated carbon and nitrogen cycle, water budget, and wild fire impacts for OR, WA, AZ and NM, for a project funded by the USDA Forest Service (PNW 09-JV-11261900-003). The MC1 model...
This dataset represents the average amount of soil carbon within each HUC5 watershed, simulated by the model MC1 for the 30-year period 1971-2000. Soil carbon, in g m-2, was determined for each HUC5 watershed. Watersheds represent 5th level (HUC5, 10-digit) hydrologic unit boundaries and were acquired from the Natural Resources Conservation Service. Background: The dynamic global vegetation model MC1 (see Bachelet et al.2001) was used to simulate vegetation dynamics, associated carbon and nitrogen cycle, water budget, and wild fire impacts for OR, WA, AZ and NM, for a project funded by the USDA Forest Service (PNW09-JV-11261900-003). The MC1 model was run using historical data and future climate change projections...
|

|
