Filters: Tags: worldclim (X)
33 results (11ms)|
Filters
Date Range
Extensions Types Contacts
Categories Tag Types
|
This dataset is one of a dozen or so datasets that provide the basis for a vulnerability assessment of the Great Northern LCC that examines land use and climate changes at landscape scales, for the full LCC boundary. It provides a measure of vulnerability based on temperature change using a watershed-based analysis. The values range from 0 to 1 and are unitless, where Vtw = Et x (1-Aw). The original floating point values ranging from 0-1.0 were multiplied by 100 and converted to integer format for this dataset.
Categories: Data;
Types: Citation,
Downloadable,
GeoTIFF,
Map Service,
Raster;
Tags: Great Northern LCC,
LCCVP,
WorldClim,
exposure,
terrestrial,
Exposure (vulnerability) index for the future time period (2061-2080) representing projected climate conditions from the Meteorological Research Institute's Coupled Atmosphere-Ocean General Circulation Model, version 3, and the rcp85 emissions scenario. The exposure model uses LANDFIRE vegetation data and Worldclim climate data .The raster values represent exposure scores for the corresponding vegetation type. The modeled vegetation types can be spatially associated with the exposure values by overlaying them with the "landfire_veg_sw_300m.tif" raster.Exposure values represent where the location falls in climate space relative to its recent historical distribution:5 (core 5% of historical climate space); 10 (5 -...
Categories: Data;
Types: Downloadable,
GeoTIFF,
Map Service,
Raster;
Tags: 2061-2080,
Drought, Fire and Extreme Weather,
Fire,
Forests,
Landscapes,

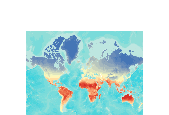
WorldClim is a set of global climate layers (climate grids) with a spatial resolution of a square kilometer. They can be used for mapping and spatial modeling in a GIS or other computer programs. The data layers were generated through interpolation of average monthly climate data from weather stations. Variables included are monthly total precipitation, and monthly mean, minimum and maximum temperature, and 19 derived bioclimatic variables.

WorldClim is a set of global climate layers (climate grids) with a spatial resolution of a square kilometer. They can be used for mapping and spatial modeling in a GIS or other computer programs. The data layers were generated through interpolation of average monthly climate data from weather stations. Variables included are monthly total precipitation, and monthly mean, minimum and maximum temperature, and 19 derived bioclimatic variables.

WorldClim is a set of global climate layers (climate grids) with a spatial resolution of a square kilometer. They can be used for mapping and spatial modeling in a GIS or other computer programs. The data layers were generated through interpolation of average monthly climate data from weather stations. Variables included are monthly total precipitation, and monthly mean, minimum and maximum temperature, and 19 derived bioclimatic variables.

WorldClim is a set of global climate layers (climate grids) with a spatial resolution of a square kilometer. They can be used for mapping and spatial modeling in a GIS or other computer programs. The data layers were generated through interpolation of average monthly climate data from weather stations. Variables included are monthly total precipitation, and monthly mean, minimum and maximum temperature, and 19 derived bioclimatic variables.
Exposure (vulnerability) index for the future time period (2041-2060) representing projected climate conditions from the Model for Interdisciplinary Research on Climate, Earth System Model, Chemistry Coupled (MIROC-ESM-CHEM) and the rcp85 emissions scenario. The exposure model uses LANDFIRE vegetation data and Worldclim climate data .The raster values represent exposure scores for the corresponding vegetation type. The modeled vegetation types can be spatially associated with the exposure values by overlaying them with the "landfire_veg_sw_300m.tif" raster.Exposure values represent where the location falls in climate space relative to its recent historical distribution:5 (core 5% of historical climate space); 10...
Categories: Data;
Types: Downloadable,
GeoTIFF,
Map Service,
Raster;
Tags: 2041-2060,
Drought, Fire and Extreme Weather,
Fire,
Forests,
Landscapes,
Exposure (vulnerability) index for the future time period (2061-2080) representing projected climate conditions from the MRI-CGCM3 GCM and the rcp45 emissions scenario. The exposure model uses LANDFIRE vegetation data and Worldclim climate data .The raster values represent exposure scores for the corresponding vegetation type. The modeled vegetation types can be spatially associated with the exposure values by overlaying them with the "landfire_veg_sw_300m.tif" raster.Exposure values represent where the location falls in climate space relative to its recent historical distribution:5 (core 5% of historical climate space); 10 (5 - 10%; still very good); ... ; 95 (90 - 95%; within the historical distribution, but getting...
Categories: Data;
Types: Downloadable,
GeoTIFF,
Map Service,
Raster;
Tags: 2061-2080,
Drought, Fire and Extreme Weather,
Fire,
Forests,
Landscapes,
This dataset is one of a dozen or so datasets that provide the basis for a vulnerability assessment of the Great Northern LCC that examines land use and climate changes at landscape scales, for the full LCC boundary. It represents terrestrially-defined adaptive capacity, where values run from 0 to 1.0 and is calculated as the complement of the degree of human modification (1-H). The original floating point values ranging from 0-1.0 were multiplied by 100 and converted to integer format for this dataset.
Categories: Data;
Types: Citation,
Downloadable,
GeoTIFF,
Map Service,
Raster;
Tags: Great Northern LCC,
LCCVP,
WorldClim,
exposure,
terrestrial,

WorldClim is a set of global climate layers (climate grids) with a spatial resolution of a square kilometer. They can be used for mapping and spatial modeling in a GIS or other computer programs. The data layers were generated through interpolation of average monthly climate data from weather stations. Variables included are monthly total precipitation, and monthly mean, minimum and maximum temperature, and 19 derived bioclimatic variables.

WorldClim is a set of global climate layers (climate grids) with a spatial resolution of a square kilometer. They can be used for mapping and spatial modeling in a GIS or other computer programs. The data layers were generated through interpolation of average monthly climate data from weather stations. Variables included are monthly total precipitation, and monthly mean, minimum and maximum temperature, and 19 derived bioclimatic variables.

WorldClim is a set of global climate layers (climate grids) with a spatial resolution of a square kilometer. They can be used for mapping and spatial modeling in a GIS or other computer programs. The data layers were generated through interpolation of average monthly climate data from weather stations. Variables included are monthly total precipitation, and monthly mean, minimum and maximum temperature, and 19 derived bioclimatic variables.
Exposure (vulnerability) index for the future time period (2041-2060) representing projected climate conditions from the Meterological Research Institute's Coupled Atmosphere-Ocean General Circulation Model (MRI-CGCM3) and the rcp45 emissions scenario. The exposure model uses LANDFIRE vegetation data and Worldclim climate data .The raster values represent exposure scores for the corresponding vegetation type. The modeled vegetation types can be spatially associated with the exposure values by overlaying them with the "landfire_veg_sw_300m.tif" raster.Exposure values represent where the location falls in climate space relative to its recent historical distribution:5 (core 5% of historical climate space); 10 (5 -...
Categories: Data;
Types: Downloadable,
GeoTIFF,
Map Service,
Raster;
Tags: 2041-2060,
Drought, Fire and Extreme Weather,
Fire,
Forests,
Landscapes,

The points in this shapefile represent locations of the weather stations assembled for use in devloping the WorldClim dataset. WorldClim was developed by Robert J. Hijmans, Susan Cameron, and Juan Parra, at the Museum of Vertebrate Zoology, University of California, Berkeley, in collaboration with Peter Jones and Andrew Jarvis (CIAT), and with Karen Richardson (Rainforest CRC).

WorldClim is a set of global climate layers (climate grids) with a spatial resolution of a square kilometer. They can be used for mapping and spatial modeling in a GIS or other computer programs. The data layers were generated through interpolation of average monthly climate data from weather stations. Variables included are monthly total precipitation, and monthly mean, minimum and maximum temperature, and 19 derived bioclimatic variables.
WorldClim is a set of global climate layers (climate grids) with a spatial resolution of a square kilometer. They can be used for mapping and spatial modeling in a GIS or other computer programs. The data layers were generated through interpolation of average monthly climate data from weather stations. Variables included are monthly total precipitation, and monthly mean, minimum and maximum temperature, and 19 derived bioclimatic variables.
This dataset is one of a dozen or so datasets that provide the basis for a vulnerability assessment of the Great Northern LCC that examines land use and climate changes at landscape scales, for the full LCC boundary. It is an exposure variable that represents the temperature change (degrees C) from baseline (1950-2000) to future (2061-2080).
Categories: Data;
Types: Citation,
Downloadable,
GeoTIFF,
Map Service,
Raster;
Tags: Exposure,
Great Northern LCC,
LCCVP,
WorldClim,
vulnerability assessment

WorldClim is a set of global climate layers (climate grids) with a spatial resolution of a square kilometer. They can be used for mapping and spatial modeling in a GIS or other computer programs. The data layers were generated through interpolation of average monthly climate data from weather stations. Variables included are monthly total precipitation, and monthly mean, minimum and maximum temperature, and 19 derived bioclimatic variables.

WorldClim is a set of global climate layers (climate grids) with a spatial resolution of a square kilometer. They can be used for mapping and spatial modeling in a GIS or other computer programs. The data layers were generated through interpolation of average monthly climate data from weather stations. Variables included are monthly total precipitation, and monthly mean, minimum and maximum temperature, and 19 derived bioclimatic variables.

WorldClim is a set of global climate layers (climate grids) with a spatial resolution of a square kilometer. They can be used for mapping and spatial modeling in a GIS or other computer programs. The data layers were generated through interpolation of average monthly climate data from weather stations. Variables included are monthly total precipitation, and monthly mean, minimum and maximum temperature, and 19 derived bioclimatic variables.
|

|
