Filters: partyWithName: U.S. Geological Survey (X) > partyWithName: David M. Wolock (X)
7 results (117ms)|
Filters
Date Range
Contacts
Categories Tag Types Tag Schemes |
These data were released prior to the October 1, 2016 effective date for the USGS’s policy dictating the review, approval, and release of scientific data as referenced in USGS Survey Manual Chapter 502.8 Fundamental Science Practices: Review and Approval of Scientific Data for Release. This 5-kilometer resolution raster (grid) dataset for the conterminous United States represents the average percentage of infiltration-excess overland flow in total streamflow estimated by the watershed model TOPMODEL. Infiltration-excess overland flow is simulated in TOPMODEL as precipitation that exceeds the infiltration capacity of the soil and enters the stream channel. TOPMODEL was applied to 5- by 5-kilometer areas across the...
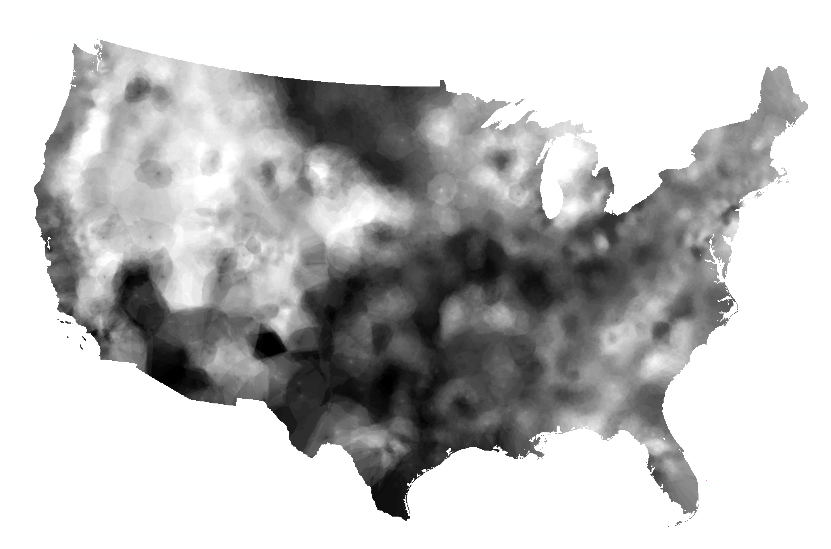
This 1-kilometer raster (grid) dataset for the conterminous United States was created by interpolating base-flow index (BFI) values estimated at U.S. Geological Survey (USGS) streamgages. Base flow is the component of streamflow that can be attributed to ground-water discharge into streams.
This metadata record describes two metrics that quantitatively measure the impact of reservoir storage on every flowline in the NHDPlus version 2 data suite (NHDPlusV2) for the conterminous United States. These metrics are computed for every 10 years from 1800 - 2015. The first metric (DamIndex_EROM.zip) estimates reservoir storage intensity in units of days based on reservoir storage in a contributing area normalized by the mean annual streamflow. This metric indicates the duration of storage impact upstream from each stream segment relative to the typical flow condition. In addition, this metric provides an assessment of the potential influence of a dam on average and low flows because the metric estimates the...

These data were released prior to the October 1, 2016 effective date for the USGS’s policy dictating the review, approval, and release of scientific data as referenced in USGS Survey Manual Chapter 502.8 Fundamental Science Practices: Review and Approval of Scientific Data for Release. This 5-kilometer resolution raster (grid) dataset for the conterminous United States represents the average percentage of saturation overland flow in total streamflow estimated by the watershed model TOPMODEL. Saturation overland flow is simulated in TOPMODEL as precipitation that falls on saturated land-surface areas and enters the stream channel. TOPMODEL was applied to 5- by 5-kilometer areas across the conterminous United States...
Categories: pre-SM502.8;
Tags: Dunne overland flow,
NSDI,
Saturation overland flow,
Streamflow generation,
TOPMODEL,

These data were released prior to the October 1, 2016 effective date for the USGS’s policy dictating the review, approval, and release of scientific data as referenced in USGS Survey Manual Chapter 502.8 Fundamental Science Practices: Review and Approval of Scientific Data for Release. This 1-kilometer raster (grid) dataset for the conterminous United States was created by i nterpolating base-flow index (BFI) values estimated at U.S. Geological Survey (USGS) streamgages. Base flow is the component of streamflow that can be attributed to ground-water discharge into streams.
Categories: pre-SM502.8;
Tags: Base-flow index,
Conterminous United States,
NSDI,
USGS Science Data Catalog (SDC),
environment,

These data were released prior to the October 1, 2016 effective date for the USGS’s policy dictating the review, approval, and release of scientific data as referenced in USGS Survey Manual Chapter 502.8 Fundamental Science Practices: Review and Approval of Scientific Data for Release. This 1-kilometer resolution raster (grid) dataset is an index of mean annual natural ground-water recharge. The dataset was created by multiplying a grid of base-flow index (BFI) values by a grid of mean annual runoff values derived from a 1951-80 mean annual runoff contour map. Mean annual runoff is long-term average streamflow expressed on a per-unit-area basis. The concept used to construct the dataset is based on two assumptions:...
Categories: pre-SM502.8;
Tags: Base-flow index,
Conterminous United States,
Ground-water recharge,
NSDI,
USGS Science Data Catalog (SDC),
Note: this data release has been deprecated. Find the new version here: https://doi.org/10.5066/P9QCLGKM. This NetCDF represents the monthly inputs and outputs from a United States Geological Survey water-balance model (McCabe and Wolock, 2011) for the conterminous United States for the period 1895-01-01 to 2020-12-31. The source data used to run the water balance model is based on the National Oceanic and Atmospheric Administration's(NOAA, 2020) ClimGrid data for precipitation and temperature. This NetCDF contains the following monthly inputs: temperature (degrees Celsius) and precipitation (millimeters, mm) and the following outputs (all in mm): runoff, soil moisture storage, actual evapotranspiration, potential...
|

|
