Filters: partyWithName: Integrated Modeling & Prediction Division (X)
Folder: ROOT ( Show direct descendants )
325 results (12ms)
LocationFilters
Date Range
Extensions Types
Contacts
Categories Tag Types
|

These data were released prior to the October 1, 2016 effective date for the USGS’s policy dictating the review, approval, and release of scientific data as referenced in USGS Survey Manual Chapter 502.8 Fundamental Science Practices: Review and Approval of Scientific Data for Release. This coverage is of the state boundaries of the conterminous United States. It was derived from the Digital Line Graph (DLG) files representing the 1:2,000,000-scale map in the National Atlas of the United States. Boundaries United States

These data were released prior to the October 1, 2016 effective date for the USGS’s policy dictating the review, approval, and release of scientific data as referenced in USGS Survey Manual Chapter 502.8 Fundamental Science Practices: Review and Approval of Scientific Data for Release. This data set represents the area of National Resources Inventory irrigation system, tailwater recovery conservation practice, in square kilometers, in the conterminous United States. The data set was used as an input data layer for a national model to predict nitrate concentration in shallow ground water. Nolan and Hitt (2006) developed two national models to predict contamination of ground water by nonpoint sources of nitrate....

These data were released prior to the October 1, 2016 effective date for the USGS’s policy dictating the review, approval, and release of scientific data as referenced in USGS Survey Manual Chapter 502.8 Fundamental Science Practices: Review and Approval of Scientific Data for Release. This data set represents the amount of fresh surface water withdrawal for irrigation, in megaliters per day, in the conterminous United States. The data set was used as an input data layer for a national model to predict nitrate concentration in shallow ground water. Nolan and Hitt (2006) developed two national models to predict contamination of ground water by nonpoint sources of nitrate. The nonlinear approach to national-scale...

These data were released prior to the October 1, 2016 effective date for the USGS’s policy dictating the review, approval, and release of scientific data as referenced in USGS Survey Manual Chapter 502.8 Fundamental Science Practices: Review and Approval of Scientific Data for Release. Estuarine ecosystems are controlled by a variety of processes that operate at multiple spatial and temporal scales. Understanding the hierarchical nature of these processes will aid in prioritization of restoration efforts. This hierarchical Columbia River Estuary Ecosystem Classification (henceforth "Classification") of the Columbia River estuary is a spatial database of the tidally-influenced reaches of the lower Columbia River,...

A sequence of nine two-dimensional cross-sectional groundwater models using MODFLOW-2005 was created to study whether underpressures (subhydrostatic heads) in the Paleozoic units underlying the Great Plains of North America are a consequence of Cenozoic uplift of the area. Based on tectonostratigraphic data incorporated into these nine models, we have developed a cumulative uplift history with superimposed periods of deposition and erosion for the Great Plains for the period from 40Ma to the present. Uplift, deposition, and erosion on an 800 kilometer long geologic cross-section extending from northeast Colorado to eastern Kansas is represented in these nine time-stepped geohydrologic models. Sequential solution...

A three-dimensional MODFLOW-NWT model was constructed to better understand the effects of drought stress on the Cedar River alluvial aquifer, the principal source of municipal water for the City of Cedar Rapids, Iowa. Historically, the aquifer supported the production needs of the City of Cedar Rapids and surrounding area but between July 2011 and February 2013, Iowa experienced severe drought conditions that affected water availability for communities that relied on alluvial aquifers for their production needs. During that time, the City of Cedar Rapids observed water level declines in their horizontal collector wells (HCW) of as much as about 11 meters. Pumping from affected production wells had to be halted to...
This data release includes field measurements of flow depth and optical image sequences acquired from the Salcha River in Alaska on July 25, 2019. These data were used to develop and test a spectrally based remote sensing technique for estimating water depth from passive optical image data. The purpose of this study was to assess the feasibility of inferring water depths from optical image sequences acquired from a helicopter hovering above the river by averaging the images over time and then establishing a correlation between a spectral band ratio and field measurements of depth, and to develop a modular workflow for performing this type of analysis. Remote sensing of river bathymetry (depth) could provide a...
Dataset was generated by performing water-balance computations for the Upper Colorado River Basin for the months October 1913 through September 2017. The basin area was first divided into 17,626 4-kim grid cells, and these were then grouped by sub-basin and annual precipitation into 960 subareas; the dataset includes a lookup table for this grouping. For each of the 960 subareas, the dataset gives the model's estimates of rainfall, snowfall, albedo, net radiation, snowmelt, potential evapotranspiration, actual evapotranspiration, total runoff, snow-water equivalent, soil-water storage, groundwater storage, and air temperature.
Categories: Data;
Tags: Climatology,
Colorado River,
Hydrology,
Remote Sensing,
USGS Science Data Catalog (SDC),
Mainstem rivers are the backbone of a connected network of hydrologic units that cover the landscape. A mainstem connects a headwater source area to an outlet. This data release identifies the same mainstem paths in hydrographic datasets for the world based on the MERIT hydrography and the Natural Earth river names. Made with Natural Earth. Free vector and raster map data @ naturalearthdata.com. See "Blodgett et al., 2021, Mainstems: A logical data model implementing mainstem and drainage basin feature types based on WaterML2 Part 3: HY Features concepts https://doi.org/10.1016/j.envsoft.2020.104927" for mainstems data model details.
This U.S. Geological Survey (USGS) metadata release consists of 17 different spatial layers in GeoTIFF format. They are: 1) average water capacity (AWC.zip), 2) percent sand (Sand.zip), 3) percent silt (Silt.zip), 4) percent clay (Clay.zip), 5) soil texture (TEXT_PRMS.zip), 6) land use/land cover (LULC.zip), 7) snow values (Snow.zip), 8) summer rain values (SRain.zip), 9) winter rain values (WRain.zip), 10) leaf presence values (keep.zip), 11) leaf loss values (loss.zip), 12) percent tree canopy (CNPY.zip), 13) percent impervious surface (Imperv.zip), 14) snow depletion curve numbers (Snow.zip), 15) rooting depth (RootDepth.zip), 16) permeability values (Lithology_exp_Konly_Project.zip), and 17) water bodies. All...
Categories: Data;
Tags: Canada,
average water capacity,
boundaries,
conterminous United States of America,
geographic information systems (GIS),
This metadata record documents a set of 118 comma delimited files and a data dictionary describing the inputs for the U.S. Geological Survey Precipitation Runoff Modeling System (PRMS) which is used to drive the National Hydrologic Model (NHM) for the United States-Canada transboundary domain. The National Hydrologic Model database contains parameters for hydrologic response units (HRUs) and stream segments needed to run the NHM. These parameters are generated using python scripts to process input datasets such as digital elevation models, soil maps, and land cover classifications. Many of the parameters were left at their default model value as they would need to be calibrated as part of the PRMS model development...
This data release provides coupling of Conterminous United States and several Canadian operational reservoirs used in recent hydrologic modeling studies to authoritative national hydrographic datasets used to identify, calibrate, model, and assess streamflow, water quantity, quality, and ecological resources. The National Inventory of Dams (NID) provides linkages to dams operated in the United States, GRanD provides linkages to Global Dams and Reservoirs, and the National Hydrography Dataset Plus (NHDPlus) provides linkages to the stream network and waterbodies to easily couple with National Hydrologic Models and landscape parameters. The Geospatial Fabric for National Hydrologic Modeling, version 1.1 (GFv1.1) provides...
Categories: Data;
Tags: National Inventory of Dams (NID),
USGS Science Data Catalog (SDC),
United States,
Water Resources,
dam sites,
This data release contains the standard statistical suite (version 1.0) daily streamflow performance benchmark results for the National Water Model Retrospective (v2.1) at streamflow benchmark locations defined by Foks and others (2022). Modeled hourly timesteps were converted to mean daily timesteps. Model error was determined by evaluating predicted daily mean streamflow versus observed daily mean streamflow using various statistics; the Nash-Sutcliffe efficiency (NSE), the Kling-Gupta efficiency (KGE), the logNSE, the Pearson correlation coefficient, the Spearman correlation coefficient, the ratio of the standard deviation, the percent bias, the percent bias in flow duration curve midsegment slope, the percent...
This data release contains annual peak-flow data and PeakFQ output files for 186 selected streamflow gaging stations (streamgages) operated by the U.S. Geological Survey (USGS) in the New England region (Maine, Connecticut, Massachusetts, Rhode Island, New York, New Hampshire, and Vermont). The annual peak-flow data were obtained from the USGS National Water Information System (NWIS) database (https://nwis.waterdata.usgs.gov/usa/nwis/peak) and contain annual peak flows ending in water year 2011. The annual peak flows were used in version 7.0 of USGS software PeakFQ (https://water.usgs.gov/software/PeakFQ/; Veilleux and others, 2014; Flynn and others, 2006) to conduct flood-frequency analyses using the Expected Moments...

These data were released prior to the October 1, 2016 effective date for the USGS’s policy dictating the review, approval, and release of scientific data as referenced in USGS Survey Manual Chapter 502.8 Fundamental Science Practices: Review and Approval of Scientific Data for Release. These data present a ground-water inventory of existing geospatial data and other information needed to determine the extent and characteristics of the aquifers in the Tahoe Basin. Geospatial and other data include geologic maps and soil surveys of the entire basin and for specific watersheds within the basin at the best available scales; vegetation remote-sensing datasets; well information from various local, state, and federal...
These data were released prior to the October 1, 2016 effective date for the USGS’s policy dictating the review, approval, and release of scientific data as referenced in USGS Survey Manual Chapter 502.8 Fundamental Science Practices: Review and Approval of Scientific Data for Release. The raster-based Modified Soil Adjusted Vegetation Index was derived from Landsat Thematic Mapper imagery data acquired during June 1992 for the Death Valley regional flow system. The index has been shown to increase the dynamic range of the vegetation signal while further minimizing the soil background influences, resulting in greater vegetation sensitivity as defined by a "vegetation signal" to "soil noise" ratio. The data set...
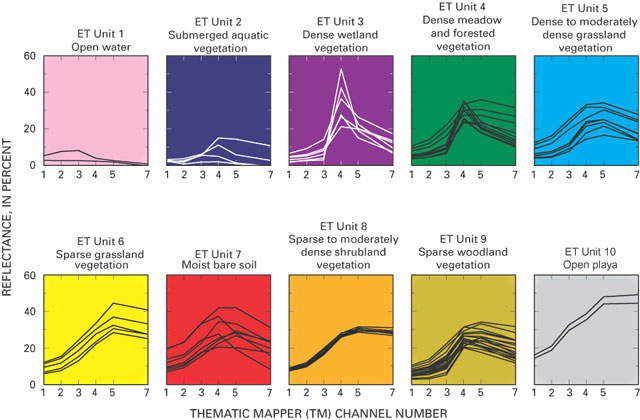
These data were released prior to the October 1, 2016 effective date for the USGS’s policy dictating the review, approval, and release of scientific data as referenced in USGS Survey Manual Chapter 502.8 Fundamental Science Practices: Review and Approval of Scientific Data for Release. The raster-based classification of evapotranspiration (ET) units is for nine major discharge areas in the Death Valley regional flow system. The ET units delineate general areas of similar vegetation and soil-moisture conditions. Classifications were derived from Landsat Thematic Mapper imagery data acquired June 13, 1992; Sept. 1, 1992; and June 21, 1989.
These data were released prior to the October 1, 2016 effective date for the USGS’s policy dictating the review, approval, and release of scientific data as referenced in USGS Survey Manual Chapter 502.8 Fundamental Science Practices: Review and Approval of Scientific Data for Release. This data set contains the main stem of the Humboldt River as defined by Humboldt Project personnel of the U.S. Geological Survey Nevada District, 2001. The data set was digitized on screen using digital orthophoto quadrangles from 1994.

These data were released prior to the October 1, 2016 effective date for the USGS’s policy dictating the review, approval, and release of scientific data as referenced in USGS Survey Manual Chapter 502.8 Fundamental Science Practices: Review and Approval of Scientific Data for Release. This digital dataset defines the model grid, active cells in model layers 2 and 3, and geologic province arrays of the ZONE package used in the transient hydrologic model of the Central Valley flow system. The Central Valley encompasses an approximate 50,000 square-kilometer region of California. The complex hydrologic system of the Central Valley is simulated using the USGS numerical modeling code MODFLOW-FMP (Schmid and others,...

These data were released prior to the October 1, 2016 effective date for the USGS’s policy dictating the review, approval, and release of scientific data as referenced in USGS Survey Manual Chapter 502.8 Fundamental Science Practices: Review and Approval of Scientific Data for Release. The Rogue River drains 13,390 square kilometers of southwestern Oregon before flowing into the Pacific Ocean near the town of Gold Beach, Oregon. The Rogue River begins in the Cascade Range and traverses the Klamath Mountains, where it gains its largest tributaries, the Applegate (1,994 square kilometers) and Illinois (2,564 square kilometers) Rivers, on its way to the coast. In cooperation with the U.S. Army Corps of Engineers,...
|

|
