Filters: Types: Citation (X) > Date Range: {"choice":"month"} (X)
112 results (64ms)|
Filters
Date Types (for Date Range)
Types (Less)
Contacts (Less)
Categories (Less) Tag Types
|
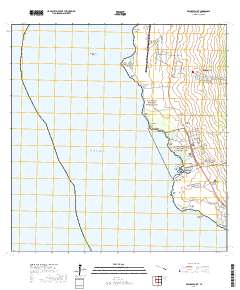
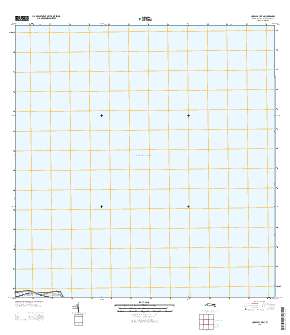
Layered geospatial PDF 7.5 Minute Quadrangle Map. Layers of geospatial data include orthoimagery, roads, grids, geographic names, elevation contours, hydrography, and other selected map features. This map is derived from GIS (geospatial information system) data. It represents a repackaging of GIS data in traditional map form, not creation of new information. The geospatial data in this map are from selected National Map data holdings and other government sources.
This dataset consists of short-term (~31 years) shoreline change rates for the north coast of Alaska between the Point Barrow and Icy Cape. Rate calculations were computed within a GIS using the Digital Shoreline Analysis System (DSAS) version 4.3, an ArcGIS extension developed by the U.S. Geological Survey. Short-term rates of shoreline change were calculated using a linear regression rate-of-change method based on available shoreline data between 1979 and 2010. A reference baseline was used as the originating point for the orthogonal transects cast by the DSAS software. The transects intersect each shoreline establishing measurement points, which are then used to calculate short-term rates.
Categories: Data;
Types: Citation,
Downloadable,
Map Service,
OGC WFS Layer,
OGC WMS Layer,
Shapefile;
Tags: Arctic,
Barrow,
CMGP,
Chukchi Sea,
Coastal and Marine Geology Program,
This dataset has been superseded. The most current data for this data release are available here: https://www.sciencebase.gov/catalog/item/663a57e7d34e77890839b06f This dataset consists of short-term (~32 years) shoreline change rates for the north coast of Alaska between the U.S. Canadian Border and the Hulahula River. Rate calculations were computed within a GIS using the Digital Shoreline Analysis System (DSAS) version 4.3, an ArcGIS extension developed by the U.S. Geological Survey. Short-term rates of shoreline change were calculated using a linear regression rate-of-change method based on available shoreline data between 1978 and 2010. A reference baseline was used as the originating point for the orthogonal...
Categories: Data;
Types: Citation,
Downloadable,
Map Service,
OGC WFS Layer,
OGC WMS Layer,
Shapefile;
Tags: ANWR,
Arctic,
Arctic National Wildlife Refuge,
Barter Island,
Beaufort Sea,
Layered GeoPDF Quadrangle Map. Layers of geospatial data include orthoimagery, roads, grids, geographic names, elevation contours, hydrography, and other selected map features.
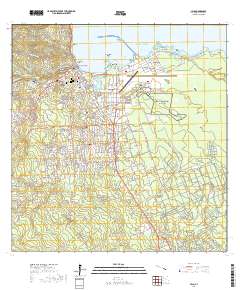
Layered geospatial PDF 7.5 Minute Quadrangle Map. Layers of geospatial data include orthoimagery, roads, grids, geographic names, elevation contours, hydrography, and other selected map features. This map is derived from GIS (geospatial information system) data. It represents a repackaging of GIS data in traditional map form, not creation of new information. The geospatial data in this map are from selected National Map data holdings and other government sources.
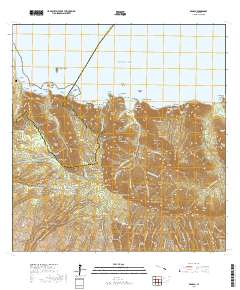
Layered geospatial PDF 7.5 Minute Quadrangle Map. Layers of geospatial data include orthoimagery, roads, grids, geographic names, elevation contours, hydrography, and other selected map features. This map is derived from GIS (geospatial information system) data. It represents a repackaging of GIS data in traditional map form, not creation of new information. The geospatial data in this map are from selected National Map data holdings and other government sources.
This dataset includes a reference baseline used by the Digital Shoreline Analysis System (DSAS) to calculate rate-of-change statistics for the sheltered north coast of Alaska coastal region between the Colville River and Point Barrow for the time period 1947 to 2012. This baseline layer serves as the starting point for all transects cast by the DSAS application and can be used to establish measurement points used to calculate shoreline-change rates.
Categories: Data;
Types: Citation,
Downloadable,
Map Service,
OGC WFS Layer,
OGC WMS Layer,
Shapefile;
Tags: Arctic,
Baseline,
Beaufort Sea,
CMGP,
Cape Halkett,
This dataset has been superseded. The most current data for this data release are available here: https://www.sciencebase.gov/catalog/item/663a50c9d34e77890839b03b This dataset consists of long-term (~63 years) shoreline change rates for the north coast of Alaska between the Hulahula River and the Colville River. Rate calculations were computed within a GIS using the Digital Shoreline Analysis System (DSAS) version 4.3, an ArcGIS extension developed by the U.S. Geological Survey. Long-term rates of shoreline change were calculated using a linear regression rate-of-change method based on available shoreline data between 1947 and 2010. A reference baseline was used as the originating point for the orthogonal transects...
Categories: Data;
Types: Citation,
Downloadable,
Map Service,
OGC WFS Layer,
OGC WMS Layer,
Shapefile;
Tags: ANWR,
Arctic,
Arctic National Wildlife Refuge,
Beaufort Sea,
CMGP,
This dataset has been superseded. The most current data for this data release are available here: https://www.sciencebase.gov/catalog/item/663a51ded34e77890839b048 This dataset includes a reference baseline used by the Digital Shoreline Analysis System (DSAS) to calculate rate-of-change statistics for the exposed north coast of Alaska coastal region between the Hulahula River and the Colville River for the time period 1947 to 2010. This baseline layer serves as the starting point for all transects cast by the DSAS application and can be used to establish measurement points used to calculate shoreline-change rates.
Categories: Data;
Types: Citation,
Downloadable,
Map Service,
OGC WFS Layer,
OGC WMS Layer,
Shapefile;
Tags: ANWR,
Arctic,
Arctic National Wildlife Refuge,
Baseline,
Beaufort Sea,
Layered GeoPDF Quadrangle Map. Layers of geospatial data include orthoimagery, roads, grids, geographic names, elevation contours, hydrography, and other selected map features.
Types: Citation;
Tags: 7.5 x 7.5 minute,
Downloadable Data,
EarthCover,
GeoPDF,
Imagery and Base Maps,
Layered geospatial PDF 7.5 Minute Quadrangle Map. Layers of geospatial data include orthoimagery, roads, grids, geographic names, elevation contours, hydrography, and other selected map features. This map is derived from GIS (geospatial information system) data. It represents a repackaging of GIS data in traditional map form, not creation of new information. The geospatial data in this map are from selected National Map data holdings and other government sources.
Layered geospatial PDF 7.5 Minute Quadrangle Map. Layers of geospatial data include orthoimagery, roads, grids, geographic names, elevation contours, hydrography, and other selected map features. This map is derived from GIS (geospatial information system) data. It represents a repackaging of GIS data in traditional map form, not creation of new information. The geospatial data in this map are from selected National Map data holdings and other government sources.
Layered geospatial PDF 7.5 Minute Quadrangle Map. Layers of geospatial data include orthoimagery, roads, grids, geographic names, elevation contours, hydrography, and other selected map features. This map is derived from GIS (geospatial information system) data. It represents a repackaging of GIS data in traditional map form, not creation of new information. The geospatial data in this map are from selected National Map data holdings and other government sources.
Types: Citation;
Tags: 7.5 x 7.5 minute,
Anaehoomalu, HI,
Downloadable Data,
EarthCover,
Geospatial PDF,
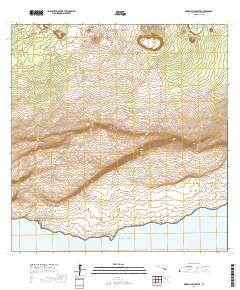
Layered geospatial PDF 7.5 Minute Quadrangle Map. Layers of geospatial data include orthoimagery, roads, grids, geographic names, elevation contours, hydrography, and other selected map features. This map is derived from GIS (geospatial information system) data. It represents a repackaging of GIS data in traditional map form, not creation of new information. The geospatial data in this map are from selected National Map data holdings and other government sources.
This data set contains genetic information collected from eelgrass (Zostera marina) populations along the Pacific coast of North America from Alaska to Baha California. A total of 447 samples were collected comprising 401 unique individuals (genets) and 46 clones (ramets) from which 10 microsatellite DNA loci were obtained.
Categories: Data;
Types: Citation;
Tags: Alleles,
Angiosperms (Flowering Plants),
Aquatic Biology,
Aquatic ecosystems,
Bahia Magdelena,
Terrestrial ecosystems, such as forests, and the inland waters within them, such as bogs, floodplains, lakes, rivers, springs, and wetlands, are foundational for life on earth. They provide critical ecosystem services such as carbon storage and sequestration, clean water, primary production, pollination, soil fertility, and erosion control. The human footprint on terrestrial and freshwater ecosystems continues to expand, imposing pressures from deforestation, invasive species, climate change, overexploitation of species, and land conversion for agricultural production. The United Nations’ Sustainable Development Goal (SDG) 15 (Life on Land) aims to address these changes by promoting the protection, restoration,...
Categories: Publication;
Types: Citation
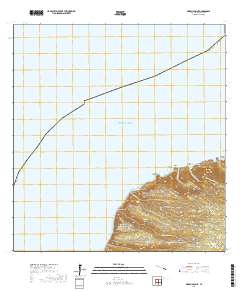
Layered geospatial PDF 7.5 Minute Quadrangle Map. Layers of geospatial data include orthoimagery, roads, grids, geographic names, elevation contours, hydrography, and other selected map features. This map is derived from GIS (geospatial information system) data. It represents a repackaging of GIS data in traditional map form, not creation of new information. The geospatial data in this map are from selected National Map data holdings and other government sources.
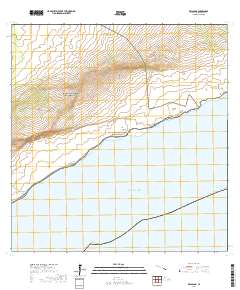
Layered geospatial PDF 7.5 Minute Quadrangle Map. Layers of geospatial data include orthoimagery, roads, grids, geographic names, elevation contours, hydrography, and other selected map features. This map is derived from GIS (geospatial information system) data. It represents a repackaging of GIS data in traditional map form, not creation of new information. The geospatial data in this map are from selected National Map data holdings and other government sources.
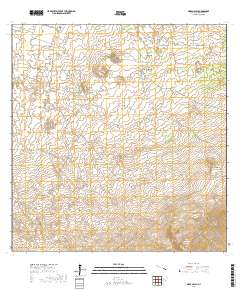
Layered geospatial PDF 7.5 Minute Quadrangle Map. Layers of geospatial data include orthoimagery, roads, grids, geographic names, elevation contours, hydrography, and other selected map features. This map is derived from GIS (geospatial information system) data. It represents a repackaging of GIS data in traditional map form, not creation of new information. The geospatial data in this map are from selected National Map data holdings and other government sources.
Layered geospatial PDF 7.5 Minute Quadrangle Map. Layers of geospatial data include orthoimagery, roads, grids, geographic names, elevation contours, hydrography, and other selected map features. This map is derived from GIS (geospatial information system) data. It represents a repackaging of GIS data in traditional map form, not creation of new information. The geospatial data in this map are from selected National Map data holdings and other government sources.
|

|
