Filters: Types: OGC WMS Layer (X) > Tags: {"scheme":"ISO 19115 Topic Category"} (X) > Categories: Collection (X)
35 results (25ms)|
Filters
Contacts
(Less)
|
The Northwest Boreal Landscape Conservation Cooperative (NWB LCC) is a partnership between agencies involved in land management across Alaska, Yukon, Northwest Territories, and British Columbia. The NWB LCC aims to coordinate science and support to decision makers for improving land management decisions. Knowledge gaps have been identified by the NWB LCC and are beginning to be filled. One of the priority information gaps is knowledge of the anthropogenic footprint currently on the landscape.The anthropogenic footprint is all the disturbance types made by various human activities, usually through some form of industrial development. Examples include roads, power lines, pipelines, and clear cuts among many others....
Categories: Collection,
Data;
Types: Map Service,
OGC WFS Layer,
OGC WMS Layer,
OGC WMS Service;
Tags: Academics & scientific researchers,
BUILDINGS,
BUILDINGS,
COMMUNICATIONS,
COMMUNICATIONS,
These rasters represent estimated potential evapotranspiration (mm). Data were generated by using the Hamon equation and air temperature projections from the ECHAM5 model under the A1B emissions scenario.
This data set represents an updated Ecological Subsection Map for Northern Alaska. This 2012 revision focused on completing the incompletely mapped portion of the southern NPRA, improving mapping of glacial and outwash deposits within the Brooks Foothills, and improving consistency with existing surficial and bedrock geology maps in northern Alaska. The revisions resulted in 525 ecological subsections, nested within 55 ecosections and 12 ecoregions covering 411,781 km2. Attributes for the polygons include information on physiography, generalized geology, lithology, and referenced information sources. Description of attributes is provided in the map documentation report. The dataset can be downloaded from catalog.northslope.org.
The Integrated Monitoring in Bird Conservation Regions (IMBCR) program is one of the largest breeding bird monitoring programs in North America. The program was developed in 2007 to address the need for a collaborative avian monitoring program that produces scientifically defensible estimates of bird distribution and abundance across various spatial scales. The program’s objectives were established following guidelines published by the North American Bird Conservation Initiative’s (NABCI) Monitoring Subcommittee for improving avian monitoring in North America. NABCI outlined four recommendations: (1) fully integrate monitoring into bird management and conservation practices; (2) coordinate monitoring programs among...
These maps show baseline (1961-1990) average total precipitation and projected change in precipitation for the decades spanning 2010-2039, 2040-2069, and 2070-2099. Precipitation is expressed in both millimeters (mm) and inches (in); projected change in precipitation is expressed as percent of baseline. Baseline results for 1961-1990 are derived from Climate Research Unit (CRU) TS 3.1.01 data and maps for future time periods are based on a composite of projections from five GCMs (CCSM4, GFDL-CM3, GISS-E2-R, IPSL-CM5A-LR, and MRI-CGCM3) under the AR5-RCP 8.5. Data courtesy of Scenarios Network for Alaska and Arctic Planning.
Categories: Collection,
Data;
Types: Map Service,
OGC WFS Layer,
OGC WMS Layer,
OGC WMS Service;
Tags: Arctic Landscape Conservation Cooperative data.gov,
Collection,
Interested public,
LCC Network Science Catalog,
PRECIPITATION,
This collection of files contains raw location data for shorebirds tagged with tracking devices and can be found in the raw data folder.Directories include: Argos_REPH, Argos_WHIM, GPS_PESA_AMGP_WHIM, and Pinpoint_SESA_DUNL.Argos_REPH: contains raw location data for Red Phalaropes equipped with 2-gram solar PTT tags manufactured by Microwave Telemetry, Inc in 2019 and 2020. Raw data files include annual PRV/A DS data files downloaded from the Argos website (http://argos-system.org) (.txt files) as well as data automatically downloaded by the Movebank website (www.movebank.org) (.csv file). Also included are data files (.kml and .txt files) obtained from processing the raw PRV/A DS data files with the Microwave MTI...
Categories: Collection,
Data;
Types: Map Service,
OGC WFS Layer,
OGC WMS Layer,
OGC WMS Service;
Tags: ANIMALS/VERTEBRATES,
BIOLOGICAL CLASSIFICATION,
BIRDS,
Collection,
EARTH SCIENCE,
This collection of files contains separate excel files for raw banding data as obtained from site principal investigators. These fies can be found in the raw data folder.
Categories: Collection,
Data;
Types: Map Service,
OGC WFS Layer,
OGC WMS Layer,
OGC WMS Service;
Tags: ANIMALS/VERTEBRATES,
Arctic,
BIOLOGICAL CLASSIFICATION,
BIRDS,
Collection,
Final report detailing the results of the climate change vulnerability assessment conducted by the Wildlife Conservation Society. The specific goals of this assessment were to: provide a climate change vulnerability ranking for selected Arctic Alaskan breeding bird species; evaluate the relative contribution of specific sensitivity and exposure factors to individual species rankings; consider how this assessment may be integrated with other approaches; and appraise the effectiveness of the NatureServe Climate Change Vulnerability Index (CCVI) tool.
The daily boat tracks of the 1997-2001 summer skiff-based double-sampling surveys were recorded to an onboard computer using the custom survey software RECORD (John I. Hodges, FWS-MBM-Alaska, retired). The tracks were recorded by capturing the skiff’s location from a GPS every five seconds as long as the software was running. The software was started at some time between the boat’s engine start and the start of the survey, and was shut down at some time between the end of the survey and engine shut-down. The tracks may thus include the boat’s travel to and from the home base. Note that the following boat tracks are missing: all 1997 tracks; one track on 08/12/1998; one track on 08/08/2001; one track on 08/09/2001.
Categories: Collection,
Data;
Types: Map Service,
OGC WFS Layer,
OGC WMS Layer,
OGC WMS Service;
Tags: ANIMALS/VERTEBRATES,
BIOLOGICAL CLASSIFICATION,
BIRDS,
Collection,
DUCKS/GEESE/SWANS,
These rasters represent estimated potential evapotranspiration (mm). Data were generated by using the Hamon equation and historical air temperature projections from the CRU dataset.
Desert LCC Base Maps and Data describe the physical and cultural geography of the Desert Landscape Conservation Cooperative. These products include the Desert LCC vector boundary available as a shapefile and KML, as well as print-quality graphic design files for thematic maps including Watersheds, Land Cover, Vegetation and a Base Map. The scale of the maps is 1:2,500,000. About the Desert LCC Region: Forty percent of the Desert LCC area lies in the United States and the remaining 60 percent, in Mexico. The total DLCC area is 536,955 square miles or 1,390,713 square kilometers. To explore data per Desert LCC priorities, visit the Conservation Planning Atlas.
Categories: Collection,
Data;
Types: Map Service,
OGC WFS Layer,
OGC WMS Layer,
OGC WMS Service;
Tags: Academics & scientific researchers,
Arizona,
California,
Collection,
Conservation NGOs,
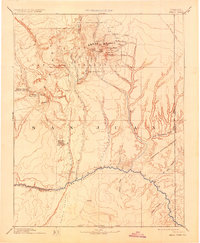
USGS Historical Quadrangle in GeoPDF. The USGS Historical Quadrangle Scanning Project (HQSP) is scanning all scales and all editions of topographic maps published by the U.S. Geological Survey (USGS) since the inception of the topographic mapping program in 1884.
Categories: Collection;
Types: Citation,
Map Service,
OGC WFS Layer,
OGC WMS Layer,
OGC WMS Service;
Tags: Public Land Survey System,
U.S. National Grid,
US,
USGS:bb7b145f-8d7f-405b-96ae-348d61172951,
United States,
Description
Categories: Collection,
Data;
Types: Map Service,
OGC WFS Layer,
OGC WMS Layer,
OGC WMS Service;
Tags: California,
Collection,
Gravity database,
Individual Samples,
K-12,
These maps show baseline (1961-1990) average air temperature and projected air temperature for the decades spanning 2010-2039, 2040-2069, and 2070-2099. Temperature is expressed in both Celsius (у) and Fahrenheit (ц). Baseline results for 1961-1990 are derived from Climate Research Unit (CRU) TS 3.1. data and maps for future time periods are based on a composite of projections from five GCMs (CCSM4, GFDL-CM3, GISS-E2-R, IPSL-CM5A-LR, and MRI-CGCM3) under the AR5-RCP 8.5. Data courtesy of Scenarios Network for Alaska and Arctic Planning.
Categories: Collection,
Data;
Types: Map Service,
OGC WFS Layer,
OGC WMS Layer,
OGC WMS Service;
Tags: Arctic Landscape Conservation Cooperative data.gov,
Collection,
Interested public,
LCC Network Science Catalog,
PRECIPITATION,
These maps were created by Arctic LCC staff and depict the general boundaries of the Arctic LCC. Maps and boundaries are subject to review and should not be used within a legal context. No warranty expressed or implied is made regarding the accuracy or utility of the data and information on any other system or for general or scientific purposes.
Categories: Collection,
Data;
Types: Map Service,
OGC WFS Layer,
OGC WMS Layer,
OGC WMS Service;
Tags: ADMINISTRATIVE DIVISIONS,
ADMINISTRATIVE DIVISIONS,
Arctic Landscape Conservation Cooperative data.gov,
BOUNDARIES,
BOUNDARIES,
|

|
