Filters: Date Range: {"choice":"week"} (X) > Tags: {"scheme":"ISO 19115 Topic Category","name":"imagerybasemapsearthcover"} (X)
Folder: ROOT ( Show direct descendants )
805 results (79ms)
LocationFilters
Date Types (for Date Range)
Contacts (Less)
Categories (Less) Tag Types Tags (with Scheme=ISO 19115 Topic Category) |
The National Park Service (NPS) requests burn severity assessments through an agreement with the U.S. Geological Survey (USGS) to be completed by analysts with the Monitoring Trends in Burn Severity (MTBS) Program. The MTBS Program assesses the frequency, extent, and magnitude (size and severity) of all large wildland fires (wildfires and prescribed fires) in the conterminous United States (CONUS), Alaska, Hawaii, and Puerto Rico for the period 1984 and beyond. All fires reported as greater than 1,000 acres in the western U.S. and greater than 500 acres in the eastern U.S. are mapped across all ownerships. MTBS produces a series of geospatial and tabular data for analysis at a range of spatial, temporal, and thematic...
Types: Map Service,
OGC WFS Layer,
OGC WMS Layer,
OGC WMS Service;
Tags: AK,
Alaska,
Burn severity,
Burned area,
CONUS,
This product ("Prairie fires") presents burned area boundaries for The Flint Hills Ecoregion (KS and OK), one of the most fire prone ecosystems in the United States where hundreds of thousands of acres burn annually as prescribed fire and wildfire. The prairie fire products provide the extent of larger prairie fires in the Flint Hills to record the occurrence of fire and can be used to identify individual burned areas within the perimeters. This product is published to provide fire information of the most fire prone ecosystems to individuals and land management communities for assessing burn extent and impacts on a time sensitive basis. The methods used to produce the prairie fire products from 2019 to present are...
These data products are preliminary burn severity assessments derived from data obtained from suitable imagery (including Landsat TM, Landsat ETM+, Landsat OLI, Sentinel 2A, and Sentinel 2B). The pre-fire and post-fire subsets included were used to create a differenced Normalized Burn Ratio (dNBR) image. The dNBR image attempts to portray the variation of burn severity within a fire. The severity ratings are influenced by the effects to the canopy. The severity rating is based upon a composite of the severity to the understory (grass, shrub layers), midstory trees and overstory trees. Because there is often a strong correlation between canopy consumption and soil effects, this algorithm works in many cases for Burned...
This map layer is a vector polygon shapefile of the perimeters of all currently inventoried fires occurring between calendar year 2021 and 2021 that do not meet standard MTBS size criteria. These data are published to augment the data that are available from the MTBS program. This product was produced using the methods of the Monitoring Trends in Burn Severity Program (MTBS); however, these fires do not meet the size criteria for a standard MTBS assessment. The MTBS Program assesses the frequency, extent, and magnitude (size and severity) of all large wildland fires (wildfires and prescribed fires) in the conterminous United States (CONUS), Alaska, Hawaii, and Puerto Rico for the period 1984 and beyond. MTBS typically...
The U. S. Fish and Wildlife Service (FWS) requests burn severity assessments through an agreement with the U.S. Geological Survey (USGS) to be completed by analysts with the Monitoring Trends in Burn Severity (MTBS) Program. These data products are burned area boundary shapefiles derived from post-fire sensor data (including Landsat TM, Landsat ETM+, Landsat OLI). The pre-fire and post-fire subsets included were used to create Normalized Burn Ratio (NBR) and then a differenced Normalized Burn Ratio (dNBR) image. The objective of this assessment was to generate burned area boundaries for each fire. Data bundles also include post-fire subset, pre-fire subset, NBR, and dNBR images. This map layer is a thematic raster...
The National Park Service (NPS) requests burn severity assessments through an agreement with the U.S. Geological Survey (USGS) to be completed by analysts with the Monitoring Trends in Burn Severity (MTBS) Program. The MTBS Program assesses the frequency, extent, and magnitude (size and severity) of all large wildland fires (wildfires and prescribed fires) in the conterminous United States (CONUS), Alaska, Hawaii, and Puerto Rico for the period 1984 and beyond. All fires reported as greater than 1,000 acres in the western U.S. and greater than 500 acres in the eastern U.S. are mapped across all ownerships. MTBS produces a series of geospatial and tabular data for analysis at a range of spatial, temporal, and thematic...
Types: Map Service,
OGC WFS Layer,
OGC WMS Layer,
OGC WMS Service;
Tags: AK,
Alaska,
Burn severity,
Burned area,
CONUS,
These data are high-resolution bathymetry (riverbed elevation) in compressed LAS (*.laz) format, generated from the July 17–19, 2023, hydrographic survey of Bubbly Creek and various sidings, harbors, and turning basins on the Chicago Sanitary and Ship Canal (CS&SC) in Cook County, Illinois. The survey includes all Bubbly Creek from the confluence with the CS&SC in the north to the Racine Avenue Pump station in the south; various sidings and turning basins along the CS&SC between Kedzie Avenue and South Halsted Street; and the Marine Safety Station harbor near the Chicago Harbor Lock on Lake Michigan. This survey is a continuation and enhancement of the bathymetric survey of the CS&SC in Cook County, Illinois, conducted...
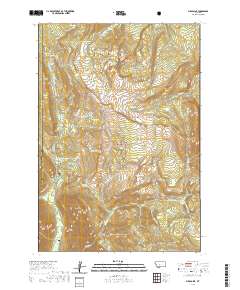
Layered geospatial PDF 7.5 Minute Quadrangle Map. Layers of geospatial data include orthoimagery, roads, grids, geographic names, elevation contours, hydrography, and other selected map features. This map is derived from GIS (geospatial information system) data. It represents a repackaging of GIS data in traditional map form, not creation of new information. The geospatial data in this map are from selected National Map data holdings and other government sources.
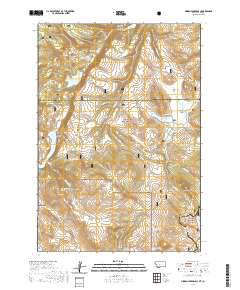
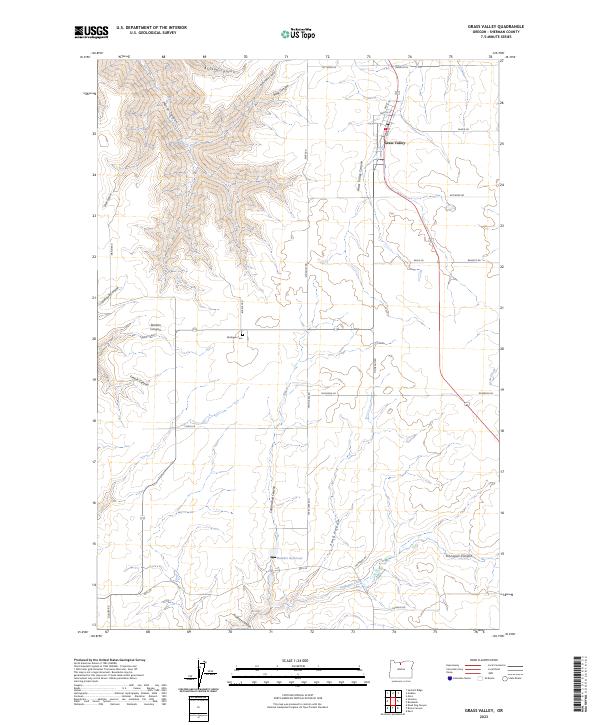
Layered geospatial PDF 7.5 Minute Quadrangle Map. Layers of geospatial data include orthoimagery, roads, grids, geographic names, elevation contours, hydrography, and other selected map features. This map is derived from GIS (geospatial information system) data. It represents a repackaging of GIS data in traditional map form, not creation of new information. The geospatial data in this map are from selected National Map data holdings and other government sources.
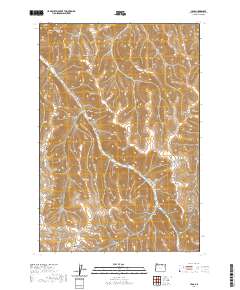
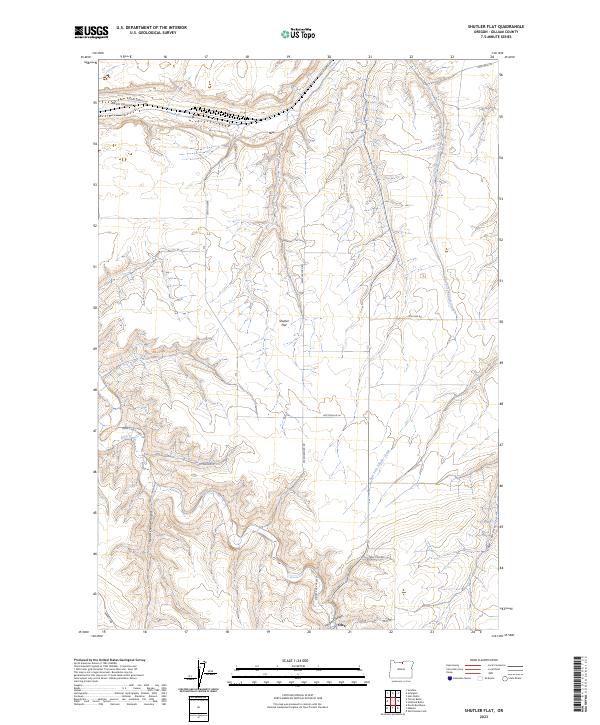
Layered geospatial PDF 7.5 Minute Quadrangle Map. Layers of geospatial data include orthoimagery, roads, grids, geographic names, elevation contours, hydrography, and other selected map features. This map is derived from GIS (geospatial information system) data. It represents a repackaging of GIS data in traditional map form, not creation of new information. The geospatial data in this map are from selected National Map data holdings and other government sources.
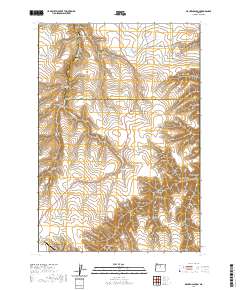
Layered geospatial PDF 7.5 Minute Quadrangle Map. Layers of geospatial data include orthoimagery, roads, grids, geographic names, elevation contours, hydrography, and other selected map features. This map is derived from GIS (geospatial information system) data. It represents a repackaging of GIS data in traditional map form, not creation of new information. The geospatial data in this map are from selected National Map data holdings and other government sources.
Layered geospatial PDF 7.5 Minute Quadrangle Map. Layers of geospatial data include orthoimagery, roads, grids, geographic names, elevation contours, hydrography, and other selected map features. This map is derived from GIS (geospatial information system) data. It represents a repackaging of GIS data in traditional map form, not creation of new information. The geospatial data in this map are from selected National Map data holdings and other government sources.
Layered geospatial PDF 7.5 Minute Quadrangle Map. Layers of geospatial data include orthoimagery, roads, grids, geographic names, elevation contours, hydrography, and other selected map features. This map is derived from GIS (geospatial information system) data. It represents a repackaging of GIS data in traditional map form, not creation of new information. The geospatial data in this map are from selected National Map data holdings and other government sources.
Layered geospatial PDF 7.5 Minute Quadrangle Map. Layers of geospatial data include orthoimagery, roads, grids, geographic names, elevation contours, hydrography, and other selected map features. This map is derived from GIS (geospatial information system) data. It represents a repackaging of GIS data in traditional map form, not creation of new information. The geospatial data in this map are from selected National Map data holdings and other government sources.
Layered geospatial PDF 7.5 Minute Quadrangle Map. Layers of geospatial data include orthoimagery, roads, grids, geographic names, elevation contours, hydrography, and other selected map features. This map is derived from GIS (geospatial information system) data. It represents a repackaging of GIS data in traditional map form, not creation of new information. The geospatial data in this map are from selected National Map data holdings and other government sources.
Layered geospatial PDF 7.5 Minute Quadrangle Map. Layers of geospatial data include orthoimagery, roads, grids, geographic names, elevation contours, hydrography, and other selected map features. This map is derived from GIS (geospatial information system) data. It represents a repackaging of GIS data in traditional map form, not creation of new information. The geospatial data in this map are from selected National Map data holdings and other government sources.
Layered geospatial PDF 7.5 Minute Quadrangle Map. Layers of geospatial data include orthoimagery, roads, grids, geographic names, elevation contours, hydrography, and other selected map features. This map is derived from GIS (geospatial information system) data. It represents a repackaging of GIS data in traditional map form, not creation of new information. The geospatial data in this map are from selected National Map data holdings and other government sources.
|

|
