Filters: Date Range: {"choice":"week"} (X) > partyWithName: Water Resources (X)
Folders: ROOT > Users ( Show direct descendants )
31 results (15ms)
Location
Folder
ROOT _Users Filters
Date Types (for Date Range)
Types
Contacts
Categories Tag Types
|
A multiple machine-learning model (Asquith and Killian, 2024) implementing Cubist and Random Forest regressions was used to predict monthly mean groundwater levels through time for the available years described in the metadata for the Mississippi River Valley alluvial aquifer (MRVA). The MRVA is the surficial aquifer of the Mississippi Alluvial Plain (MAP), located in the south-central United States. Employing two machine-learning techniques offered the opportunity to generate model and statistical error and covariance between them to estimate total uncertainty. Potentiometric surface predictions were made at the 1-kilometer grid scale using the National Hydrogeologic Grid (Clark and others, 2018). For a full description...
Types: Map Service,
OGC WFS Layer,
OGC WMS Layer,
OGC WMS Service;
Tags: USGS Science Data Catalog (SDC)
A generic, three-dimensional finite-difference model, MODFLOW-2005 (version 1.12.00) and MODPATH-6 (version 6.0.01), was created to better understand the amount of vertical flow and cross-contamination of trichloroethene (TCE) that may be occurring in discontinued extraction wells under current (2018-19) ambient-flow conditions at site 25 of the Edwards Air Force Base, California. The wells are long-screened (100-ft long), contain a surrounding sandpack, and have not been pumped for approximately 10 years. The groundwater flow model utilized multiple observations made from the field measurements of flow and transport to conceptualize, calculate, and simulate in-well flow, and flow in the sand pack. The model was...
The Geneva Industries/Fuhrmann Energy Superfund Site (hereinafter referred to as "the Site") in southeastern Houston, Texas was historically used as a site for petroleum exploration and petrochemical production and is currently (2024) inactive. Previous remedies to clean up the contaminated site included the excavation and off-site disposal of polychlorinated biphenyl (PCB)-contaminated soils, capping the Site and surrounding it with a perimeter slurry wall to contain remaining constituents in the soil and groundwater, the recovery and treatment of trichloroethylene (TCE)-contaminated groundwater, and institutional controls (U.S. Environmental Protection Agency [EPA], 2018). A conceptual site model (CSM) does not...
A series of field measurements of surface water velocity derived from video and Doppler velocity radar collected by small unoccupied aircraft systems (sUAS) and portable sensors were collected at seven locations in Colorado, USA, during the summer of 2023. The measurements were utilized to compute surface velocity and discharge using the Probability Concept, Large-Scale Particle Image Velocimetry (LSPIV), and Space-Time Image Velocimetry (STIV) methods. This data release includes the original videos, radar spectra, and ancillary data necessary to produce the surface water velocity and streamflow results. Data are grouped into sections (child items) based on the data type and purpose: Ancillary Scripts: this child...
Tags: Anthracite Creek, Gunnison County, Colorado, United States of America,
Aspen, Pitkin County, Colorado, United States of America,
Blue River, Summit County, Colorado, United States of America,
Colorado River, Garfield County, Colorado, United States of America,
Dillon, Summit County, Colorado, United States of America,

These data were released prior to the October 1, 2016 effective date for the USGS’s policy dictating the review, approval, and release of scientific data as referenced in USGS Survey Manual Chapter 502.8 Fundamental Science Practices: Review and Approval of Scientific Data for Release. The Coquille River system is an unregulated system that encompasses 2,745 square kilometers of southwestern Oregon and flows into the Pacific Ocean near the town of Bandon, Oregon. Beginning in the Rogue River-Siskiyou National Forest, the South Fork Coquille River gains the Middle Fork Coquille River (drainage area 798 square kilometers) and shortly thereafter the North Fork Coquille River (749 square kilometers). In cooperation...
The watershed data management (WDM) database SC16.WDM is updated with the processed data for the period October 1, 2016, through September 30, 2017, and renamed as SC17.WDM. The precipitation data are collected from a tipping-bucket rain-gage network and the hydrologic data (stage and discharge) are collected at USGS streamflow-gaging stations in and around DuPage County, Illinois. Hourly precipitation and hydrologic data for the period October 1, 2016, through September 30, 2017, are processed following the guidelines described in Bera (2014) and appended to SC16.WDM and renamed as SC17.WDM. Meteorological data (wind speed, solar radiation, air temperature, dewpoint temperature, and potential evapotranspiration)...
Categories: Data;
Types: Map Service,
OGC WFS Layer,
OGC WMS Layer,
OGC WMS Service;
Tags: USGS Science Data Catalog (SDC)
This data release (DR) is the update of the U.S. Geological Survey - ScienceBase data release Bera (2023), with the processed data for the period October 1, 2021, through September 30, 2022. This data release describes the watershed data management (WDM) database SC22.WDM. The precipitation data are collected from a tipping-bucket rain-gage network and the hydrologic data (stage and discharge) are collected at USGS streamflow-gaging stations in and around Salt Creek watershed in DuPage County, Illinois, as described in Bera (2014). Hourly precipitation and hydrologic data for the period October 1, 2021, through September 30, 2022, are processed following the guidelines described in Bera (2014) and Murphy and Ishii...
The California Groundwater Ambient Monitoring and Assessment Program (GAMA) is a statewide assessment of groundwater quality designed to help better understand and identify risks to groundwater resources. GAMA is implemented by the California State Water Resources Control Board. The U.S. Geological Survey (USGS) is the technical lead for the Priority Basin Project (PBP), one of the components of the GAMA Program. Starting in 2012, GAMA began an assessment of water resources in domestic-supply (shallow) aquifers in California. These domestic-supply aquifers provide water for domestic and small community-supply wells, which are often drilled to shallower depths in the groundwater system than public-supply wells. Domestic-supply...
The U.S. Geological Survey (USGS), in cooperation with the Washington State Department of Ecology (Ecology), conducted a study to describe the current understanding of the regional groundwater system of the lower Duwamish River valley and groundwater and surface-water interactions in the lower Duwamish Waterway. A nearshore site along the western shoreline of the Duwamish River, about 1.5 mi upstream from the river mouth, was selected for focused groundwater data collection by USGS. Data loggers were deployed in seven groundwater wells and one stilling well in the Duwamish River to measure specific conductance, temperature, and depth at 15-minute intervals for a period of about 2 years.This data release contains...
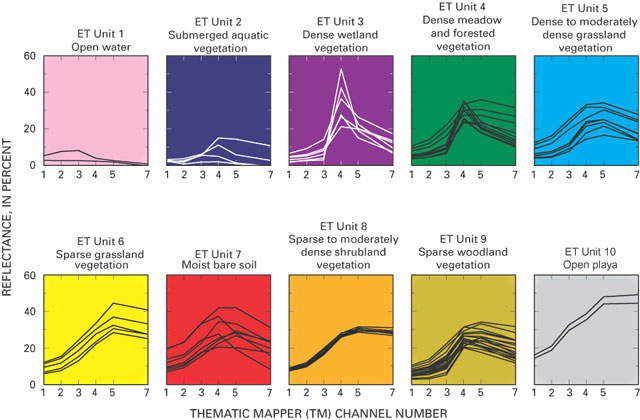
These data were released prior to the October 1, 2016 effective date for the USGS’s policy dictating the review, approval, and release of scientific data as referenced in USGS Survey Manual Chapter 502.8 Fundamental Science Practices: Review and Approval of Scientific Data for Release. The raster-based classification of evapotranspiration (ET) units is for nine major discharge areas in the Death Valley regional flow system. The ET units delineate general areas of similar vegetation and soil-moisture conditions. Classifications were derived from Landsat Thematic Mapper imagery data acquired June 13, 1992; Sept. 1, 1992; and June 21, 1989.
This dataset was developed to estimate point-source total nitrogen and phosphorous loads to streams in the conterminous United States (U.S.) from December 1999 to November 2020. This dataset uses discharge and concentration information from point sources to streams in the conterminous United States from the U.S. Environmental Protection Agency (EPA) Integrated Compliance Information System - Permit Compliance System (ICIS-PCS) database. Nutrient concentrations were used to calculate point source loads. However, measured concentration data was often not available so “typical pollutant concentrations” (TPCs) were developed using concentration data from the same facility but a different time or from similar facilities....
The WDM database SC17.WDM is updated with the quality-assured and quality-controlled (QA/QC) data from October 1, 2017, through September 30, 2018, and renamed as SC18.WDM. Meteorological data (wind speed, solar radiation, air temperature, dew point temperature, and potential evapotranspiration) and the three digit flags corresponding to wind speed, solar radiation, air temperature, and dew point temperature are copied from ARGN18.WDM and stored in this database. Data in dataset number (DSN) 107 and 801–810 are used in comparisons of precipitation data. DSN 107 contains hourly precipitation data collected at Argonne National Laboratory at Argonne, Illinois. DSN 801-810 contains the processed Next Generation Weather...
Categories: Data Release - Under Revision;
Types: Map Service,
OGC WFS Layer,
OGC WMS Layer,
OGC WMS Service;
Tags: Hydrology,
USGS Science Data Catalog (SDC),
Water Resources
See Full Metadata Here This dataset contains the initial 3D Hydrography Program (3DHP) flow network topology which is based on the final High Resolution National Hydrography Dataset (NHD) and a set of mainstem river identifiers based on on the Medium resolution NHDPlus Version 2 (NHDPlusV2). The 3DHP flow network topology and mainstem identifiers contained in this data release add two key pieces of information to the flow table of the National Hydrography Dataset: 1) at every junction, one and only one main upstream and downstream connection have been identified 2) every "in network" flowline has been assigned a mainstem identifier that places it into a hierarchy of rivers and drainage basins. For description...
An extreme flood in 2016 caused widespread culvert blockages and road failures across northern Wisconsin, including extensive damage along steep tributaries and ravines in the Marengo River watershed. Along with the flooding, there were fluvial erosion hazards (FEH) associated with a large amount of erosion in headwater areas. Of special concern were FEHs associated with gullying, loss of wetland storage, and valley-side mass wasting. In 2020, a pilot study was begun to map and classify ephemeral and perennial streams and wetlands in terms of their susceptibility to fluvial erosion hazards. This study combines rapid geomorphic field assessments of river corridor erosion and coupled sediment and debris delivery with...
Categories: Data,
Map;
Types: Downloadable,
Map Service,
OGC WFS Layer,
OGC WMS Layer,
Shapefile;
Tags: Ashland,
Bad-Montreal,
Geomorphology,
Great Lakes,
North America,
The karstic Edwards and Trinity aquifers are classified as major sources of water in south-central Texas by the Texas Water Development Board, and both are classified as major aquifers by the State of Texas. The Edwards and Trinity aquifers developed because of the original depositional history of the carbonate limestone and dolomite rocks that contain them, and the primary and secondary porosity, diagenesis, fracturing, and faulting that modified the porosity, permeability, and transmissivity of each aquifer and of the geologic units separating the aquifers. Previous studies such as those by the U.S. Geological Survey (USGS) and the Edwards Aquifer Authority (EAA) have mapped the geology, hydrostratigraphy, and...
This data release contains phytoplankton data and vertical profile measurements of water quality and light in oligotrophic (low nutrient) lakes within the Adirondack Park, New York State. Data were collected between June and October 2021 at five lakes. Four lake locations (Nearshore, Open Water, Layer, Bloom) were sampled representing one of four sample types (Bottom Sediment, Surface Water, Bloom Material, Layer). Water-quality field parameters (water temperature, dissolved-oxygen concentration and percent saturation, pH, specific conductance, turbidity, chlorophyll fluorescence, phycocyanin fluorescence, and fluorescent dissolved organic material) were measured at each sampling location from the surface to the...
Categories: Data;
Types: ArcGIS REST Map Service,
ArcGIS Service Definition,
Downloadable,
Map Service,
OGC WFS Layer,
OGC WMS Layer,
OGC WMS Service;
Tags: Adirondack Park,
Algal concentration,
Blue Mountain Lake,
Blue-green algae,
Brant Lake,
This dataset contains tabular data at three scales (city, tract, and synoptic site) and related vector shapefiles (for watersheds or buffers around synoptic sites) for areas included in the Carbon in Urban River Biogeochemistry Project (CURB) to assess how social, built, and biophysical factors shape aquatic functions. The city scale included 486 urban areas in the continental United States with greater than 50,000 residents. Tabular data are provided for each urban area (CURB_CensusUrbanArea.csv) and all U.S. Census tracts within seven urban areas (Atlanta, GA, Boston, MA, Miami, FL, Phoenix, AZ, Portland, OR, Salt Lake City, UT, and San Francisco, CA; CURB_CensusTract.csv) to characterize a range of social, built,...
The Massachusetts Drought Management Plan (DMP, 2023) uses data from select lake and impoundment systems as an index for drought in six of seven regions in the state. The contents of these lakes and impoundments are reported to Massachusetts Department of Conservation and Recreation (DCR) and classified as one of five levels for drought severity ranging from level 0 (Normal; percentile greater than 30) to level 4 (Emergency; percentile less than 2). Lake and impoundment system data are provided at the end of each month to DCR through multiple agencies as lake levels, volumes, or percent-full (reservoir capacity). USGS reviewed data from 14 of the lake or impoundment systems including 28 waterbodies. Diagrams for...
Categories: Data;
Types: Map Service,
OGC WFS Layer,
OGC WMS Layer,
OGC WMS Service;
Tags: Aaron River Reservoir,
Ashley Lake,
Ashumet Pond,
Assawompset Pond,
Birch Pond,
The U.S. Geological Survey (USGS) collected field survey data and developed one-dimensional U.S. Army Corps of Engineers (USACE) Hydrologic Engineering Center’s River Analysis System (HEC-RAS) hydraulic models for selected stream crossing sites in the Squannacook River Basin, north-central Massachusetts. A Geographic Information System (GIS) was developed to derive model input data from Light Detection and Ranging (lidar) Digital Elevation Models (DEM) at each stream crossing location. Hydraulic models were built for existing culvert designs as well as preliminary culvert designs for a 3-sided box, 3-sided arch, and a pipe culvert using field survey and GIS data. The preliminary culvert models were designed to convey...
This data set includes estimates of aquatic chlorophyll a concentration and reservoir temperature for Blue Mesa Reservoir, CO. A Random Forest modeling approach was trained to model near-surface aquatic chlorophyll a using near-coincident Sentinel-2 satellite imagery and water samples analyzed for chlorophyll a concentration. The trained chlorophyll a model was applied to Sentinel-2 imagery to produce maps of modeled chlorophyll a concentrations at 10 m spatial resolution for May through October for 2016 through 2023. Chlorophyll a concentrations for three sections (basins) of Blue Mesa Reservoir were extracted from the raster data to produce time-series of modeled chlorophyll a concentration summary statistics...
Categories: Data;
Types: Map Service,
OGC WFS Layer,
OGC WMS Layer,
OGC WMS Service;
Tags: Blue Mesa Reservoir,
Colorado,
Curecanti National Recreation Area,
Remote Sensing,
USGS Science Data Catalog (SDC),
|

|
