Filters: Date Range: {"choice":"year"} (X) > Tags: {"type":"Theme"} (X) > Types: OGC WMS Service (X) > partyWithName: U.S. Geological Survey (X)
157 results (124ms)|
Filters
Date Types (for Date Range)
Types Contacts
Categories
Tag Schemes
|
This dataset describes irrigation water use in Kansas in 2015. Volumes of water used, irrigated area, and average irrigation application depths are provided for three sets of subareas: (1) Irrigation water use analysis regions that include Groundwater Management Districts (GMDs) with the areas outside of GMDs divided into eastern, central, and western Kansas; (2) Regional Planning Areas (RPAs), which are 14 areas determined by the Kansas Water Office based on hydrologic and administrative boundaries, each with a set of goals outlined in the Kansas Water Vision (https://kwo.ks.gov/water-plan/water-vision); and (3) the 105 Kansas counties. Volumes of water used, irrigated area, and average application depths are also...
This dataset contains all the layers associated with U.S. Geological Survey (USGS) Great Lakes Coastal Wetland Restoration Assessment (GLCWRA) initiative for the Upper Peninsula Restoration Assessment (UPRA) which aims to identify and rank coastal areas with the greatest potential for wetland habitat restoration. Each layer has a unique contribution to the identification of restorable wetlands. The 7 parameters (Parameter 0: Mask, Parameter 1: Hydroperiod, Parameter 2: Wetland Soils, Parameter 3: Flowlines, Parameter 4: Conservation and Recreation Lands, Parameter 5: Impervious Surfaces, and Parameter 6: Land Use) and Index Composite directly correlate to areas that are recommended for restoration. The dikes, degree...
Categories: Data Release - Revised;
Types: GeoTIFF,
Map Service,
OGC WFS Layer,
OGC WMS Layer,
OGC WMS Service;
Tags: Chippewa,
Great Lakes,
Holocene,
Lake Huron,
Lake Michigan,
We characterized seafloor sediment conditions near the mouth of the Elwha River from underwater photographs taken every four hours from September 2011 to December 2013. A digital camera was affixed to a tripod that was deployed in approximately 10 meters of water (Tripod location from September 2011 to April 2013: 48.15333, -123.55931; tripod location from April 2013 to December 2013: 48.15407, -123.55444). Each photograph was qualitatively characterized as one of six categories: (1) base, or no sediment; (2) low sediment; (3) medium sediment; (4) high sediment; (5) turbid; or (6) kelp. For base conditions, no sediment was present on the seafloor. Low sediment conditions were characterized by a light dusting of...
Categories: Data;
Types: Citation,
Map Service,
OGC WFS Layer,
OGC WMS Layer,
OGC WMS Service;
Tags: Clallam County,
Elwha River,
Olympic Peninsula,
Remote Sensing,
State of Washington,
This dataset contains absolute-gravity data collected by the USGS Southwest Gravity Program, a collaborative effort of the Arizona, California, and New Mexico Water Science Centers to monitor and model groundwater-storage change. Data were collected following the methods in "Procedures for Field Data Collection, Processing, Quality Assurance and Quality Control, and Archiving of Relative and Absolute-Gravity Surveys", U.S. Geological Survey Techniques and Methods book 2, chapter D4 . All data are reviewed and approved. Additional gravity data, including network-adjusted relative- and absolute-gravity data, may be available in ScienceBase Data Releases.Gravity data are provided as two files:sgp_agdb_stations_YYYY-MM-DD.csv...

This dataset, termed "GAGES II", an acronym for Geospatial Attributes of Gages for Evaluating Streamflow, version II, provides geospatial data and classifications for 9,322 stream gages maintained by the U.S. Geological Survey (USGS). It is an update to the original GAGES, which was published as a Data Paper on the journal Ecology's website (Falcone and others, 2010b) in 2010. The GAGES II dataset consists of gages which have had either 20+ complete years (not necessarily continuous) of discharge record since 1950, or are currently active, as of water year 2009, and whose watersheds lie within the United States, including Alaska, Hawaii, and Puerto Rico. Reference gages were identified based on indicators that they...
Types: Map Service,
OGC WFS Layer,
OGC WMS Layer,
OGC WMS Service;
Tags: Alabama,
Alaska,
All 50 states,
Arizona,
Arkansas,
A total of 27 temperature sensors were deployed along the lower 90 miles of the Yakima River at 7 locations where cold water had been previously observed. These 7 cold-water areas had 3 to 6 temperature sensors installed to document the extent and duration of these cold-water areas and their impacts on mainstem temperatures of the Lower Yakima River. Cold-water areas included the mouths of tributaries, alongside channels, and within alcoves. Sensor deployments ranged from 1 to 2 years beginning in October 2018. All temperature data are included in the Yakima.temperatures.zip folder. Details of each monitoring location are provided in the site.locs.csv file. In addition to the raw data and site location information,...
Categories: Data;
Types: Map Service,
OGC WFS Layer,
OGC WMS Layer,
OGC WMS Service;
Tags: Aquatic Biology,
Benton County,
Ecology,
Hydrology,
Richland, WA,
This data release contains environmental and quality control results for chemical, biological, and physical sampling of water and bed sediment from Albemarle Sound and associated tributaries between 2012 and 2014 referenced in USGS OFR 2016-1171. Appendix 1 contains all quality control results to characterize the bias and variability of sampling, handling, and analysis of water, phytoplankton, and bed sediment samples. Appendix 2 contains all the chemical, biological, and physical results for water samples collected in July and August of 2012. Appendix 3 contains all the chemical, biological, and physical results for water samples collected from March 2013 to February 2014. Data are included for discrete samples...
In support of U.S. Geological Survey (USGS) Southwest Biological Science Center researchers, and in coordination with the Bureau of Land Management (BLM) and National Ecological Observatory Network (NEON), the USGS National Uncrewed Systems Office (NUSO) conducted uncrewed aircraft systems (UAS) remote sensing flights over two BLM Assessment, Inventory, and Monitoring (AIM) plots at the NEON Moab site in Utah for multi-scale carbon sequestration research on public lands. The UAS data collected include natural color, multispectral, and hyperspectral imagery, and lidar to capture diverse information about vegetation and soils on drylands. The first site (“site 1”) features intact sagebrush and was mapped on May 3,...
The National Park Service (NPS) requests burn severity assessments through an agreement with the U.S. Geological Survey (USGS) to be completed by analysts with the Monitoring Trends in Burn Severity (MTBS) Program. The MTBS Program assesses the frequency, extent, and magnitude (size and severity) of all large wildland fires (wildfires and prescribed fires) in the conterminous United States (CONUS), Alaska, Hawaii, and Puerto Rico for the period 1984 and beyond. All fires reported as greater than 1,000 acres in the western U.S. and greater than 500 acres in the eastern U.S. are mapped across all ownerships. MTBS produces a series of geospatial and tabular data for analysis at a range of spatial, temporal, and thematic...
Types: Map Service,
OGC WFS Layer,
OGC WMS Layer,
OGC WMS Service;
Tags: AK,
Alaska,
Burn severity,
Burned area,
CONUS,
These data products are preliminary burn severity assessments derived from data obtained from suitable imagery (including Landsat TM, Landsat ETM+, Landsat OLI, Sentinel 2A, and Sentinel 2B). The pre-fire and post-fire subsets included were used to create a differenced Normalized Burn Ratio (dNBR) image. The dNBR image attempts to portray the variation of burn severity within a fire. The severity ratings are influenced by the effects to the canopy. The severity rating is based upon a composite of the severity to the understory (grass, shrub layers), midstory trees and overstory trees. Because there is often a strong correlation between canopy consumption and soil effects, this algorithm works in many cases for Burned...
The National Park Service (NPS) requests burn severity assessments through an agreement with the U.S. Geological Survey (USGS) to be completed by analysts with the Monitoring Trends in Burn Severity (MTBS) Program. The MTBS Program assesses the frequency, extent, and magnitude (size and severity) of all large wildland fires (wildfires and prescribed fires) in the conterminous United States (CONUS), Alaska, Hawaii, and Puerto Rico for the period 1984 and beyond. All fires reported as greater than 1,000 acres in the western U.S. and greater than 500 acres in the eastern U.S. are mapped across all ownerships. MTBS produces a series of geospatial and tabular data for analysis at a range of spatial, temporal, and thematic...
Types: Map Service,
OGC WFS Layer,
OGC WMS Layer,
OGC WMS Service;
Tags: AK,
Alaska,
Burn severity,
Burned area,
CONUS,
This data release contains monthly 270-meter resolution Basin Characterization Model (BCMv8) climate and hydrologic variables for Localized Constructed Analog (LOCA; Pierce et al., 2014)-downscaled ACCESS 1.0 Global Climate Model (GCM) for Representative Concentration Pathway (RCP) 4.5 (medium-low emissions) and 8.5 (high emissions) for hydrologic California. The LOCA climate scenarios span water years 1950 to 2099 with greenhouse-gas forcings beginning in 2006. The LOCA downscaling method has been shown to produce better estimates of extreme events and reduces the common downscaling problem of too many low-precipitation days (Pierce et al., 2014). Ten GCMs were selected from the full ensemble of models from the...
The Geographic Names Information System (GNIS) is the Federal standard for geographic nomenclature. The U.S. Geological Survey developed the GNIS for the U.S. Board on Geographic Names, a Federal inter-agency body chartered by public law to maintain uniform feature name usage throughout the Government and to promulgate standard names to the public. The GNIS is the official repository of domestic geographic names data; the official vehicle for geographic names use by all departments of the Federal Government; and the source for applying geographic names to Federal electronic and printed products of all types. See http://geonames.usgs.gov for additional information.
Types: Citation,
Map Service,
OGC WFS Layer,
OGC WMS Layer,
OGC WMS Service;
Tags: Antarctica,
Borough,
Census Area,
Commonwealth,
County,
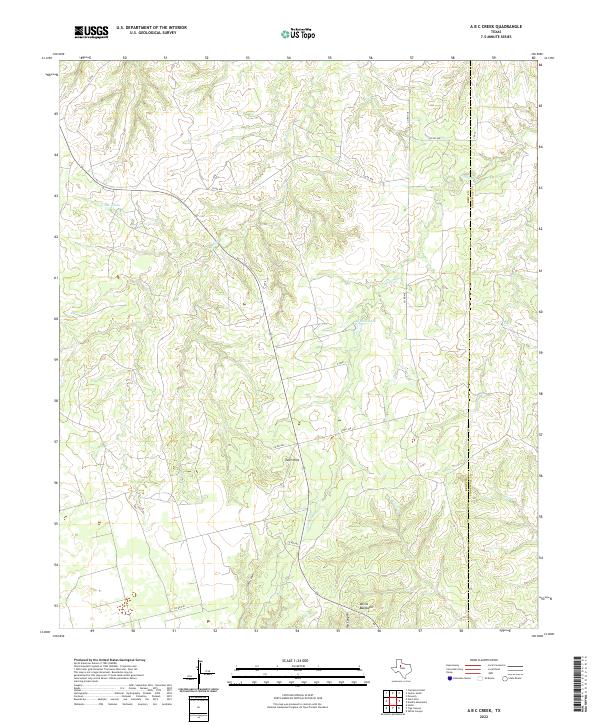
Layered geospatial PDF 7.5 Minute Quadrangle Map. Layers of geospatial data include orthoimagery, roads, grids, geographic names, elevation contours, hydrography, boundaries, and other selected map features. This map depicts geographic features on the surface of the earth. One intended purpose is to support emergency response at all levels of government. The geospatial data in this map are from selected National Map data holdings and other government sources.
Categories: Collection;
Types: Map Service,
OGC WFS Layer,
OGC WMS Layer,
OGC WMS Service;
Tags: Public Land Survey System,
U.S. National Grid,
US,
USGS:6d94af68-1f05-4f9e-9b5a-63f7a05d258b,
United States,
A monthly water balance model (MWBM) was driven with precipitation and temperature using a station-based dataset for current conditions (1949 to 2010) and selected statistically-downscaled general circulation models (GCMs) for current and future conditions (1950 to 2099) across the conterminous United States (CONUS) using hydrologic response units from the Geospatial Fabric for National Hydrologic Modeling (Viger and Bock, 2014). Six MWBM output variables (actual evapotranspiration (AET), potential evapotranspiration (PET), runoff (RO), streamflow (STRM), soil moisture storage (SOIL), and snow water equivalent (SWE)) and the two MWBM input variables (atmospheric temperature (TAVE) and precipitation (PPT)) were summarized...
Categories: Data,
Data Release - Revised;
Types: Map Service,
NetCDF OPeNDAP Service,
OGC WFS Layer,
OGC WMS Layer,
OGC WMS Service;
Tags: USGS Science Data Catalog (SDC),
United States,
Water Resources,
hydrology,
inlandWaters,
This dataset was created to support the Washington D.C. StreamStats project funded by the Washington D.C. Department of Energy and Environment (DOEE). The dataset contains digital elevation model (DEM), flow direction and catchment layers that were conditioned using Washingtons D.C.’s stormwater network layer. The data are hosted online as a component of the USGS StreamStats web application (https://streamstats.usgs.gov), where users can interact with a map of Washington D.C.’s stormwater pipe system and National Hydrography Dataset (NHD) “best resolution” blue lines to delineate drainage basins that account for pipe flow. This project utilized 1-meter (high resolution) terrain products, which improves upon existing...
In support of U.S. Geological Survey (USGS) Southwest Biological Science Center researchers, and in coordination with the Bureau of Land Management (BLM) and National Ecological Observatory Network (NEON), the USGS National Uncrewed Systems Office (NUSO) conducted uncrewed aircraft systems (UAS) remote sensing flights over two BLM Assessment, Inventory, and Monitoring (AIM) plots at the NEON Moab site in Utah for multi-scale carbon sequestration research on public lands.The UAS data collected include natural color, multispectral, and hyperspectral imagery, and lidar to capture diverse information about vegetation and soils on two dryland sites approximately 40 km south of Moab, Utah. The first site (“site 1”) features...
Categories: Data;
Types: Map Service,
OGC WFS Layer,
OGC WMS Layer,
OGC WMS Service;
Tags: Remote Sensing,
San Juan County,
UAS,
USGS Science Data Catalog (SDC),
Utah,
|

|
