Filters: Tags: Arctic (X)
361 results (62ms)|
Filters
Date Range
Extensions
Types
Contacts
Categories Tag Types
|
Abstract (from http://onlinelibrary.wiley.com/doi/10.1111/gcb.12875/abstract): Permafrost thaw can alter the soil environment through changes in soil moisture, frequently resulting in soil saturation, a shift to anaerobic decomposition, and changes in the plant community. These changes, along with thawing of previously frozen organic material, can alter the form and magnitude of greenhouse gas production from permafrost ecosystems. We synthesized existing methane (CH 4) and carbon dioxide (CO 2) production measurements from anaerobic incubations of boreal and tundra soils from the geographic permafrost region to evaluate large-scale controls of anaerobic CO 2 and CH 4 production and compare the relative importance...
Categories: Publication;
Types: Citation;
Tags: Alaska CASC,
Alaska CASC,
Glaciers and Permafrost,
Water, Coasts and Ice,
anaerobic incubation,
This dataset contains taxonomic information, counts, and lengths of macroinvertebrates collected from rivers in northwest Alaska using drift and kick nets during summer and fall 2015-2019.
This dataset consists of short-term (~32 years) shoreline change rates for the north coast of Alaska between the U.S. Canadian Border and the Hulahula River. Rate calculations were computed within a GIS using the Digital Shoreline Analysis System (DSAS) version 4.3, an ArcGIS extension developed by the U.S. Geological Survey. Short-term rates of shoreline change were calculated using a linear regression rate-of-change method based on available shoreline data between 1978 and 2010. A reference baseline was used as the originating point for the orthogonal transects cast by the DSAS software. The transects intersect each shoreline establishing measurement points, which are then used to calculate short-term rates.
Categories: Data;
Types: Citation,
Downloadable,
Map Service,
OGC WFS Layer,
OGC WMS Layer,
Shapefile;
Tags: ANWR,
Arctic,
Arctic National Wildlife Refuge,
Barter Island,
Beaufort Sea,
This dataset consists of short-term (~31 years) shoreline change rates for the north coast of Alaska between the Point Barrow and Icy Cape. Rate calculations were computed within a GIS using the Digital Shoreline Analysis System (DSAS) version 4.3, an ArcGIS extension developed by the U.S. Geological Survey. Short-term rates of shoreline change were calculated using a linear regression rate-of-change method based on available shoreline data between 1979 and 2010. A reference baseline was used as the originating point for the orthogonal transects cast by the DSAS software. The transects intersect each shoreline establishing measurement points, which are then used to calculate short-term rates.
Categories: Data;
Types: Citation,
Downloadable,
Map Service,
OGC WFS Layer,
OGC WMS Layer,
Shapefile;
Tags: Arctic,
Barrow,
CMGP,
Chukchi Sea,
Coastal and Marine Geology Program,
Alaska’s high-latitude, arctic landscape places it at the front lines of environmental change. Factors such as rising temperatures, altered precipitation patterns, and associated shifts in growing degree days, summer season length, extreme heat, and the timing of spring thaw and autumn frost are rapidly changing Alaska’s ecosystems and associated human systems. The ability of Alaska’s land managers and communities to predict these changes will profoundly affect their ability to adapt. The State of Alaska recognizes the scope and magnitude of these changes and has made it a priority to ensure anticipated change is incorporated into local and regional planning. This project will involve collaboration with agency...
Categories: Project;
Types: Map Service,
OGC WFS Layer,
OGC WMS Layer,
OGC WMS Service;
Tags: 2020,
Alaska,
Alaska CASC,
Arctic,
Arctic,
The RTK survey, using a Trimble unit, was conducted in August 2021 in the coastal plains region (1002 area) of the Arctic National Wildlife Refuge, as part of a landscape vulnerability assessment. A total of six transects are included in the data, including five research sites and one transect collected at the camp site. Mean horizontal precision was 0.006m, mean vertical precision was 0.011m.
Categories: Data;
Tags: Arctic,
Arctic National Wildlife Refuge,
Climatology,
Geography,
Geomorphology,
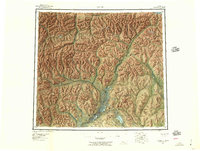
USGS Historical Quadrangle in GeoPDF.
Typed information accompanying negative: Waiting for the plane. The weather was cool but not cold, juding from the clothing. Similar to F-5 and F-6 (see links in Related Items below) Note: T-3 Photographs - Roll F B&W negatives - June paradrop, 1969. There were three paradrops during the summer of 1969 performed by Navy C-130 planes from Elmendorf Air Force Base in Fairbanks, Alaska. These are described in this website, http://www.firebirds.org/menu2/t3/t3_p02.htm On the receiving end of the paradrops on T-3, these days were the high points of the summer season. This roll documents the first paradrop, which occurred in late June on a cloudy day. The loads were delivered on target to the camp runway without...
Typed information accompanying negative: Stu on stilts: One of the crew made stilts and walked around the ice. Note: T-3 Photographs - Roll I B&W negatives – August-September 1969 This roll shows activities during August and September 1969 on T-3. The summer season had now lasted two months. The weather grew cold. Photos by Dave Scoboria.
Album caption: Figure 1. Lagena laevis (Montagu) (p. 20). USNM 241892, X 30; Kara Sea, sta. 53. 2. Laryngodigma hyalascidia (Loeblich and Tappan) (p. 20) USNM 241905, X 50; Kara Sea sta. 106 3. Bulimina exilis (Brady) (p. 17) USNM 241893, X 50; Kara Sea, sta. 53. 4. Parafissarina sp. (p. 20). USNM 241924, X 30; Greenland Sea, sta. 13. a, Front view; b, side view. 5. Parafissarina tectulostoma (Loeblich and Tappan) (p. 20). USNM 241931, X 50; Greenland Sea, sta. 33. 6. Parafissarina groenlandica (Stschedrina) (p. 20). ...
Typed information accompanying negative: Final load Note: T-3 Photographs - Roll F B&W negatives - June paradrop, 1969. There were three paradrops during the summer of 1969 performed by Navy C-130 planes from Elmendorf Air Force Base in Fairbanks, Alaska. These are described in this website, http://www.firebirds.org/menu2/t3/t3_p02.htm On the receiving end of the paradrops on T-3, these days were the high points of the summer season. This roll documents the first paradrop, which occurred in late June on a cloudy day. The loads were delivered on target to the camp runway without mishap. The second paradrop was similar, one month later. The day of the third paradrop was windy and the sky was overcast. We did not...
Typed information accompanying negative: The landscape and hydrohut in July. By mid July the weather was starting to grow colder. The snow had melted and the lakes were drying up. Note: T-3 Photographs - Roll G B&W negatives – July 4,1969 This roll of photographs was mostly taken on July 4, 1969. There was a camp get together and celebration that day. There was no alcohol on T-3 at that point. Bob Sutton chose an abandoned hut to burn and that event was the high point of the day. (Photos on Roll G taken by Dave Scoboria)
Typed information accompanying slide: UW tech with a boomerang. Time passed slowly outside of a person's work shift. June 1969. Note: T-3 Color slides - Roll C - Color slides June 1969. These photos were taken between June 6, 1969 and June 27, 1969 and developed in late 1969 into Kodacolor slides after returning from T-3. One slide has deteriorated. Photos by Dave Scoboria, except for C-6.
Typed information accompanying negative: T-3 camp in August 1969: The USGS trailer is in the left center foreground. The high spot in the right side background might be the rock pile show in earlier photos but now covering with snow. This photo is likely taken from the top of the Lamont hydrohut tower. Note: T-3 Photographs - Roll I B&W negatives – August-September 1969 This roll shows activities during August and September 1969 on T-3. The summer season had now lasted two months. The weather grew cold. Photos by Dave Scoboria.
Typed information accompanying slide: The Lamont trailer moved and leveled. June 1969. Note: T-3 Color slides - Roll C - Color slides June 1969. These photos were taken between June 6, 1969 and June 27, 1969 and developed in late 1969 into Kodacolor slides after returning from T-3. One slide has deteriorated. Photos by Dave Scoboria, except for C-6.
Typed information accompanying negatives: Bob Sutton was the camp manager during the summer of 1969. He was soft spoken, experienced, and very capable. In mid-summer he developed an abscessed tooth and suffered for several days before it was controlled with penicillin from the medical supplies. There were no medical personnel on T-3, so if a medical problem developed it was handled over the radio. There were days when the radio communication was poor or non-existent. Note: T-3 Photographs - Roll F B&W negatives - June paradrop, 1969. There were three paradrops during the summer of 1969 performed by Navy C-130 planes from Elmendorf Air Force Base in Fairbanks, Alaska. These are described in this website, http://www.firebirds.org/menu2/t3/t3_p02.htm...
Typed information accompanying photograph: Slide and print: USGS hydrohut, April 1969. Taken from the ground just outside the Lamont hydrohut. Note: T-3 Photographs - Roll B - Color slides April 1969. These photos were developed into Ektachrome slides in May of 1969. Some have deteriorated. Some were printed as color prints and these may be in better condition than the slides. A few slides were copied into Kodacolor slides. Some images are missing. Photos by Dave Scoboria.
Handwritten information accompanying photograph: Lamont ocean bottom photos. The Lamont tech took regular photos of the ocean floor. Winter 1968-1969.
Typed information accompanying slide: A wide shallow lake. At the edge of the lake there is fresh water on top of ice island, water a foot or so deep. One of the camp members walked far out on the lake. June 1969. Similar to C-32 and C-33. Links to these images listed in Web Links below. Note: T-3 Color slides - Roll C - Color slides June 1969. These photos were taken between June 6, 1969 and June 27, 1969 and developed in late 1969 into Kodacolor slides after returning from T-3. One slide has deteriorated. Photos by Dave Scoboria, except for C-6.
Handwritten information on back of photograph: 02/25/63, T-3. Cook shack - sitting with me are Arthur and Johnny (at table), 2 of the Eskimos working with us (in background). Additional information obtained from Dr. Carolyn Ruppel, Chief, U.S. Geological Survey's Gas Hydrates Project: These were likely taken during the setup phase for the laboratory "hut". I don't see in these photos any of the equipment that would have been in the hydrohut. We seem to be seeing the stove (left) and work table, but not the high bay where the piston core/heat flow probe would have been on a winch with thousands of meters of cable to lower the gear to the seafloor. It is likely that the "Eskimos" referred to for this photo were...
|

|
