Filters: Tags: Colorado (X) > Date Range: {"choice":"year"} (X)
1,510 results (252ms)|
Filters
Date Types (for Date Range)
Types Contacts
Categories Tag Types
|
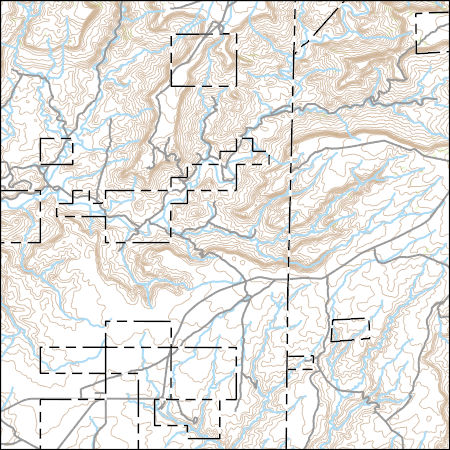
Layers of geospatial data include contours, boundaries, land cover, hydrography, roads, transportation, geographic names, structures, and other selected map features.
Estimation of irrigation water use provides essential information for the management and conservation of agricultural water resources. The blue water evapotranspiration (BWET) raster dataset at 30-meter resolution is created to estimate agricultural irrigation water consumption. The dataset contains seasonal total (1 May to 30 September) BWET time series (1986 – 2020) for the croplands across the U.S. High Plains aquifer region. The BWET estimates are generated by integrating an energy-balance ET model (Operational Simplified Surface Energy Balance model) and a water-balance ET model (Vegetation ET model). BWET in croplands reflects crop consumptive use of irrigation water extracted from surface water and groundwater...
These data were compiled for a networked field-trial restoration experiment (RestoreNet) that spans the southwestern US, including 21 distributed field sites. The objective of our study was to understand the environmental factors and restoration practices (including seed mixes and soil manipulation) that increase plant establishment and survival to ultimate improve restoration outcomes in dryland environments. These data represent point-in-time plant density and height measurements at our field sites at the time of monitoring. These data were collected at 21 arid and semi-arid sites, located throughout Arizona, Utah, New Mexico, and California. These data were collected by USGS Restoration Assessment and Monitoring...
Climate change over the past century has altered vegetation community composition and species distributions across rangelands in the western United States. The scale and magnitude of climatic influences are largely unknown. We used fractional component cover data for rangeland functional groups and weather data from the 1985 to 2023 reference period in conjunction with soils and topography data to develop empirical models describing the spatio-temporal variation in component cover. To investigate the ramifications of future change across the western US, we extended models based on historical relationships over the reference period to model landscape effects based on future weather conditions from two emissions scenarios...
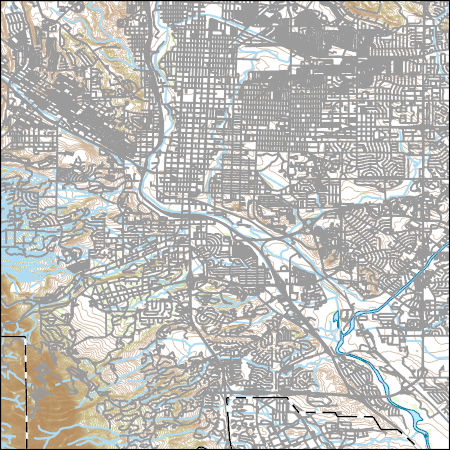
Layers of geospatial data include contours, boundaries, land cover, hydrography, roads, transportation, geographic names, structures, and other selected map features.
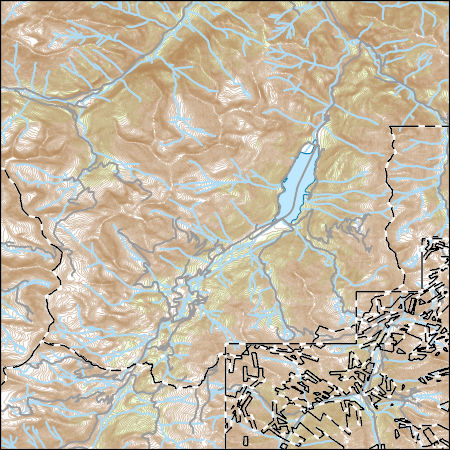
Layers of geospatial data include contours, boundaries, land cover, hydrography, roads, transportation, geographic names, structures, and other selected map features.
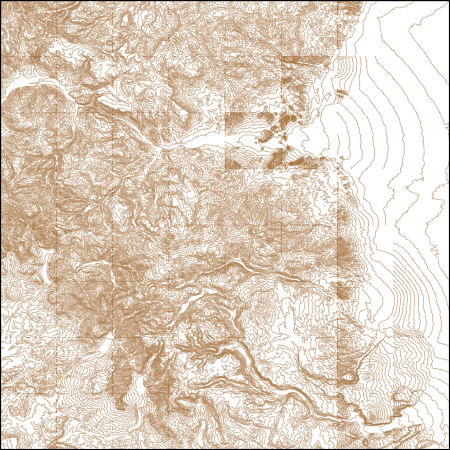
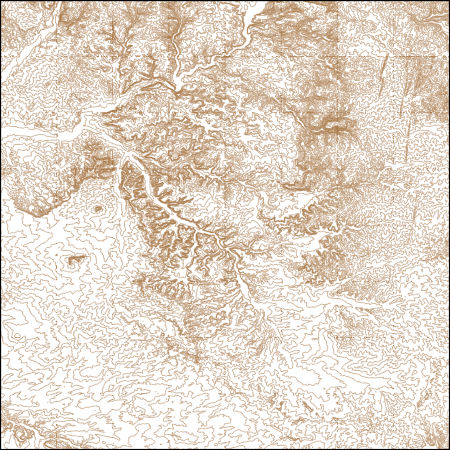
USGS NED 1/3 arc-second Contours for Durango E, Colorado 1 x 1 degree (published 20240112) Shapefile
These vector contour lines are derived from the 3D Elevation Program using automated and semi-automated processes. They were created to support 1:24,000-scale CONUS and Hawaii, 1:25,000-scale Alaska, and 1:20,000-scale Puerto Rico / US Virgin Island topographic map products, but are also published in this GIS vector format. Contour intervals are assigned by 7.5-minute quadrangle, so this vector dataset is not visually seamless across quadrangle boundaries. The vector lines have elevation attributes (in feet above mean sea level on NAVD88), but this dataset does not carry line symbols or annotation.
These vector contour lines are derived from the 3D Elevation Program using automated and semi-automated processes. They were created to support 1:24,000-scale CONUS and Hawaii, 1:25,000-scale Alaska, and 1:20,000-scale Puerto Rico / US Virgin Island topographic map products, but are also published in this GIS vector format. Contour intervals are assigned by 7.5-minute quadrangle, so this vector dataset is not visually seamless across quadrangle boundaries. The vector lines have elevation attributes (in feet above mean sea level on NAVD88), but this dataset does not carry line symbols or annotation.
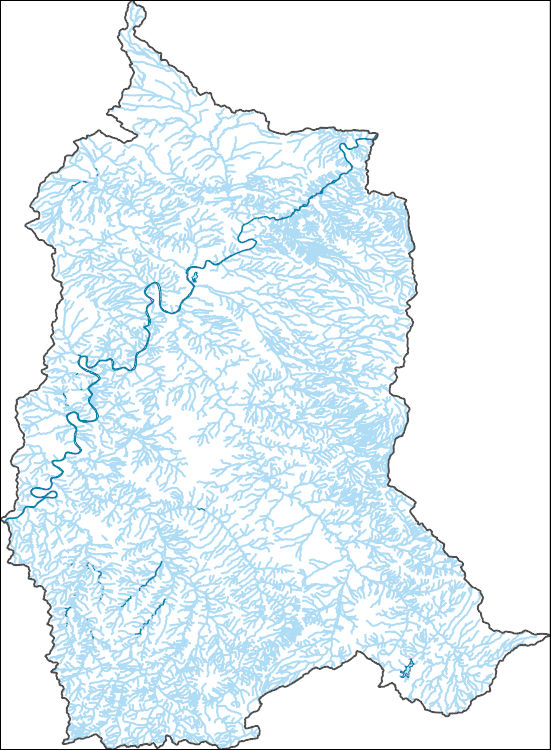
The National Hydrography Dataset (NHD) is a feature-based database that interconnects and uniquely identifies the stream segments or reaches that make up the nation's surface water drainage system. NHD data was originally developed at 1:100,000-scale and exists at that scale for the whole country. This high-resolution NHD, generally developed at 1:24,000/1:12,000 scale, adds detail to the original 1:100,000-scale NHD. (Data for Alaska, Puerto Rico and the Virgin Islands was developed at high-resolution, not 1:100,000 scale.) Local resolution NHD is being developed where partners and data exist. The NHD contains reach codes for networked features, flow direction, names, and centerline representations for areal water...
This child item describes Python code used to estimate average yearly and monthly tourism per 1000 residents within public-supply water service areas. Increases in population due to tourism may impact amounts of water used by public-supply water systems. This data release contains model input datasets, Python code used to develop the tourism information, and output estimates of tourism. This dataset is part of a larger data release using machine learning to predict public supply water use for 12-digit hydrologic units from 2000-2020. Output from this code was used as an input feature in the public supply delivery and water use machine learning models. This page includes the following files: tourism_input_data.zip...
This child item describes a public supply delivery machine learning model that was developed to estimate public-supply deliveries. Publicly supplied water may be delivered to domestic users or to commercial, industrial, institutional, and irrigation (CII) users. This model predicts total, domestic, and CII per capita rates for public-supply water service areas within the conterminous United States for 2009-2020. This child item contains model input datasets, code used to build the delivery machine learning model, and national predictions. This dataset is part of a larger data release using machine learning to predict public-supply water use for 12-digit hydrologic units from 2000-2020. This page includes the following...
This child item describes Python code used to query census data from the TigerWeb Representational State Transfer (REST) services and the U.S. Census Bureau Application Programming Interface (API). These data were needed as input feature variables for a machine learning model to predict public supply water use for the conterminous United States. Census data were retrieved for public-supply water service areas, but the census data collector could be used to retrieve data for other areas of interest. This dataset is part of a larger data release using machine learning to predict public supply water use for 12-digit hydrologic units from 2000-2020. Data retrieved by the census data collector code were used as input...
Ground-based discrete snowpack measurements were collected during winter field campaigns starting in 2020. These data were collected as part of the U.S. Geological Survey (USGS) Next Generation Water Observing System (NGWOS) Upper Colorado River Basin project focusing on the relation between snow dynamics and water resources. This data release consists of three child items. Each child item contains snow depth, snow density, snow temperature, or snow water equivalent values measured discretely in the field. The data are provided in comma separated value (CSV) files.
Categories: Data;
Types: Downloadable,
Map Service,
OGC WFS Layer,
OGC WMS Layer,
Shapefile;
Tags: Colorado,
Colorado River,
Hydrology,
Integrated Water Science,
Rocky Mountains,
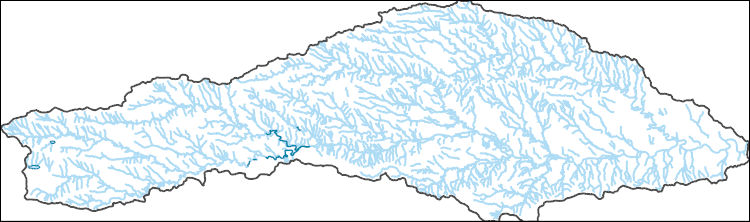
The National Hydrography Dataset (NHD) is a feature-based database that interconnects and uniquely identifies the stream segments or reaches that make up the nation's surface water drainage system. NHD data was originally developed at 1:100,000-scale and exists at that scale for the whole country. This high-resolution NHD, generally developed at 1:24,000/1:12,000 scale, adds detail to the original 1:100,000-scale NHD. (Data for Alaska, Puerto Rico and the Virgin Islands was developed at high-resolution, not 1:100,000 scale.) Local resolution NHD is being developed where partners and data exist. The NHD contains reach codes for networked features, flow direction, names, and centerline representations for areal water...
Classified probability of suitable habitat for Black Tailed Prairie Dogs for each cell of raster. Classification is based on 4 probability cutoff levels with category 1 being low habitat suitability and category 4 being high habitat suitability. Categorized probability data is created from fitting a global second-order model to county level raster data. For details on model fitting and data used to produce categorized probability raster see report. https://www.fws.gov/science/catalog
Categories: Data;
Types: Downloadable,
GeoTIFF,
Map Service,
Raster;
Tags: Black Tailed Prairie Dogs,
Colorado,
Great Plains,
Habitat suitability,
Jefferson County,
Probability of suitable habitat for Black Tailed Prairie Dogs for each cell of raster. Probability is measured from 0 to 1 with 0 being low habitat suitability and 1 being high suitability. Probability data is created from fitting a global third-order model to county level raster data. For details on model fitting and data used to produce probability raster see report. https://www.fws.gov/science/catalog
Categories: Data;
Types: Downloadable,
GeoTIFF,
Map Service,
Raster;
Tags: Black Tailed Prairie Dogs,
Colorado,
Denver County,
Great Plains,
Habitat suitability,
Probability of suitable habitat for Black Tailed Prairie Dogs for each cell of raster. Probability is measured from 0 to 1 with 0 being low habitat suitability and 1 being high suitability. Probability data is created from fitting a global second-order model to county level raster data. For details on model fitting and data used to produce probability raster see report. https://www.fws.gov/science/catalog
Categories: Data;
Types: Downloadable,
GeoTIFF,
Map Service,
Raster;
Tags: Black Tailed Prairie Dogs,
Colorado,
Great Plains,
Habitat suitability,
Jefferson County,
Classified probability of suitable habitat for Black Tailed Prairie Dogs for each cell of raster. Classification is based on 4 probability cutoff levels with category 1 being low habitat suitability and category 4 being high habitat suitability. Categorized probability data is created from fitting a global third-order model to county level raster data. For details on model fitting and data used to produce categorized probability raster see report. https://www.fws.gov/science/catalog
Categories: Data;
Types: Downloadable,
GeoTIFF,
Map Service,
Raster;
Tags: Black Tailed Prairie Dogs,
Colorado,
Great Plains,
Habitat Suitability,
Rangeland and Resources Research Unit,
Classified probability of suitable habitat for Black Tailed Prairie Dogs for each cell of raster. Classification is based on 4 probability cutoff levels with category 1 being low habitat suitability and category 4 being high habitat suitability. Categorized probability data is created from fitting a global third-order model to county level raster data. For details on model fitting and data used to produce categorized probability raster see report. https://www.fws.gov/science/catalog
Categories: Data;
Types: Downloadable,
GeoTIFF,
Map Service,
Raster;
Tags: Black Tailed Prairie Dogs,
Colorado,
Great Plains,
Habitat Suitability,
Phillips County,
Probability of suitable habitat for Black Tailed Prairie Dogs for each cell of raster. Probability is measured from 0 to 1 with 0 being low habitat suitability and 1 being high suitability. Probability data is created from fitting a global third-order model to county level raster data. For details on model fitting and data used to produce probability raster see report. https://www.fws.gov/science/catalog
Categories: Data;
Types: Downloadable,
GeoTIFF,
Map Service,
Raster;
Tags: Black Tailed Prairie Dogs,
Colorado,
Great Plains,
Habitat Suitability,
Phillips County,
|

|
