Filters: Tags: Geospatial Analysis (X)
808 results (532ms)|
Filters
Date Range
Extensions Types Contacts
Categories
Tag Types
|
Understanding how sea-level rise will affect coastal landforms and the species and habitats they support is critical for crafting approaches that balance the needs of humans and native species. Given this increasing need to forecast sea-level rise effects on barrier islands in the near and long terms, we are developing Bayesian networks to evaluate and to forecast the cascading effects of sea-level rise on shoreline change, barrier island state, and piping plover habitat availability. We use publicly available data products, such as lidar, orthophotography, and geomorphic feature sets derived from those, to extract metrics of barrier island characteristics at consistent sampling distances. The metrics are then incorporated...
Categories: Data;
Types: Downloadable,
GeoTIFF,
Map Service,
Raster;
Tags: Atlantic Ocean,
CMHRP,
Coastal Habitat,
Coastal and Marine Hazards and Resources Program,
Delmarva Peninsula,
Digital flood-inundation maps for a 9.9-mile reach of Dardenne Creek, St. Charles County, Missouri, were created by the U.S. Geological Survey (USGS) in cooperation with St. Charles County, Missouri Department of Transportation, and the cities of O'Fallon and St. Peters, Missouri. The flood-inundation maps, which can be accessed through the USGS Flood Inundation Mapping Science Program at http://water.usgs.gov/osw/flood_inundation/ , depict estimates of the areal extent and depth of flooding corresponding to select water levels (stages) at the USGS streamgages 05514860 Dardenne Creek at Old Town St. Peters, Missouri, and 05587450 Mississippi River at Grafton, Illinois. Near-real-time stages at these streamgages...
The Middle Fork Willamette River basin encompasses 3,548 square kilometers of western Oregon and drains to the mainstem Willamette River. Fall Creek basin encompasses 653 square kilometers and drains to the Middle Fork Willamette River. In cooperation with the U.S. Army Corps of Engineers, the U.S. Geological Survey evaluated geomorphic responses of downstream river corridors to annual drawdowns to streambed at Fall Creek Lake. This study of geomorphic change is focused on the major alluvial channel segments downstream of the U.S. Army Corps of Engineers’ dams on Fall Creek and the Middle Fork Willamette River, as well as the 736 hectare Fall Creek Lake. Reservoir erosion during streambed drawdown results in sediment...
Categories: Data;
Types: Downloadable,
GeoTIFF,
Map Service,
Raster;
Tags: Fall Creek,
Fall Creek Lake,
Jasper, Oregon,
Lane County,
Middle Fork Willamette River,
This study applies spatial analyses to examine the consequences of accelerated urban expansion on a hydrologic system over a period of 24 years. Three sets of historical aerial photos are used in a GIS analysis to document the geomorphic history of Las Vegas Wash, which drains the rapidly growing Las Vegas urban area in southern Nevada. New spatial techniques are introduced to make quantitative measurements of the erosion at three specific time intervals in the hydrologic evolution of the channel and floodplain. Unlike other erosion studies that use two different elevation surfaces to assess erosion, this study used a single elevation surface to remove systematic and nonsystemic elevation errors. The spatial analysis...
Digital flood-inundation maps for a 7.5-mile reach of the White River at Noblesville, Indiana, were created by the U.S. Geological Survey (USGS) in cooperation with the Indiana Department of Transportation. The flood-inundation maps, which can be accessed through the USGS Flood Inundation Mapping Science website at https://water.usgs.gov/osw/flood_inundation/, depict estimates of the areal extent and depth of flooding corresponding to selected water levels (stages) at the White River at Noblesville, Ind., streamgage (USGS station number 03349000). Real-time stages at this streamgage may be obtained from the USGS National Water Information System at https://waterdata.usgs.gov/nwis or the National Weather Service...
This dataset provides spatial predictions of habitat suitability for current (1950 – 2000 yr) and mid-Holocene (8.3 ka – 4.2 ka) intervals using hindcasting, and three separate paleo-distributions calibrated on the packrat midden archive: those without bias correction (naïve), those created with a standard method (standard), and those created with a novel alternative (modeled) incorporating a three-stage model of bias. The raster layers contained here accompany the manuscript Inman et al. 2018 and were used to evaluate utility of a novel bias correction method (modeled) over classic methods. Spatial predictions of habitat suitability were created using MaxEnt version 3.4.0 (Phillips et al., 2006), a widely-used...
Heavy rainfall occurred across Louisiana during March 8-19, 2016, as a result of a massive, slow-moving southward dip in the jet stream, which moved eastward across Mexico, then neared the Gulf Coast, funneling deep tropical moisture into parts of the Gulf States and the Mississippi River Valley. The storm caused major flooding in north-central and southeastern Louisiana. Digital flood-inundation maps for Cross Lake near the community of Shreveport in Caddo Parish, LA was created by the U.S. Geological Survey (USGS) in cooperation with Federal Emergency Management Agency (FEMA) to support response and recovery operations following a March 8-19, 2016 flood event. The inundation maps depict estimates of the areal...
This dataset provides spatial predictions of clustering and the genotype association index for the Mojave genotype in local species-environment relationships of Desert Tortoises (Gopherus agassizi and Gopherus morafkaii) for individuals in the subregion encompassing the genetic sampling locations used by Edwards et al. (2015). This region offered an opportunity to explore habitat selection across the ecotone between the Mojave and Sonoran deserts and the secondary contact zone between G. agassizii and G. morafkai, and is referred to as the focal study area. The raster layers contained here accompany the manuscript Inman et al. 2019 and were used to identify multivariate clusters and map them back to geographic space....
Digital flood-inundation polygon shapefiles for an 8.8-mile reach of the North Platte River, from 1.5 miles upstream of the Highway 92 bridge to 3 miles downstream of the Highway 71 bridge, were created by the U.S. Geological Survey (USGS) in cooperation with the Cities of Scottsbluff and Gering. The flood-inundation maps, which can be accessed through the USGS Flood Inundation Mapping Science website at http://water.usgs.gov/osw/flood_inundation/, depict estimates of the areal extent and depth of flooding corresponding to selected water levels (stages) at the USGS streamgage on the Platte River at Scottsbluff, Nebr. (station 06680500). Near-real-time stages at this streamgage may be obtained on the Internet from...
From May 2017 to November 2019, the U.S. Geological Survey conducted bathymetric surveys of New York City's East of Hudson Reservoirs. Bathymetry data were collected at Middle Branch Reservoir during July and August, 2017. Depth data were collected primarily with a multibeam echosounder. Quality assurance points were measured with a single-beam echosounder. Water surface elevations were established using real-time kinematic (RTK) and static global navigation satellite system (GNSS) surveys and submersible pressure transducers. Measured sound velocity profiles were used to correct echosounder depth measurements for thermal stratification. Digital elevation models were created by combining the measured bathymetry...
Categories: Data;
Types: Downloadable,
GeoTIFF,
Map Service,
OGC WFS Layer,
OGC WMS Layer,
Raster,
Shapefile;
Tags: Ambient Monitoring,
Basin & Hydrogeologic Characterization,
Middle Branch Reservoir,
New York,
Putnam County,
From May 2017 to November 2019, the U.S. Geological Survey conducted bathymetric surveys of New York City's East of Hudson Reservoirs. Bathymetry data were collected at West Branch Reservoir during September 2017, October 2017, and October 2019. Depth data were collected primarily with a multibeam echosounder; additional bathymetry points were measured using an acoustic Doppler current profiler (ADCP). Quality assurance points were measured with a single-beam echosounder. Water surface elevations were established using real-time kinematic (RTK) and static global navigation satellite system (GNSS) surveys and submersible pressure transducers. Measured sound velocity profiles were used to correct echosounder depth...
Categories: Data;
Types: Downloadable,
GeoTIFF,
Map Service,
OGC WFS Layer,
OGC WMS Layer,
Raster,
Shapefile;
Tags: Ambient Monitoring,
Basin & Hydrogeologic Characterization,
New York,
Putnam County,
Water Use and Availability Science,
From May 2017 to November 2019, the U.S. Geological Survey conducted bathymetric surveys of New York City's East of Hudson Reservoirs. Bathymetry data were collected at Boyd Corners Reservoir during September 2017. Depth data were collected primarily with a multibeam echosounder. Quality assurance points were measured with a single-beam echosounder. Water surface elevations were established using real-time kinematic (RTK) and static global navigation satellite system (GNSS) surveys and submersible pressure transducers. Measured sound velocity profiles were used to correct echosounder depth measurements for thermal stratification. Digital elevation models were created by combining the measured bathymetry data with...
Categories: Data;
Types: Downloadable,
GeoTIFF,
Map Service,
OGC WFS Layer,
OGC WMS Layer,
Raster,
Shapefile;
Tags: Ambient Monitoring,
Basin & Hydrogeologic Characterization,
Boyd Corners Reservoir,
New York,
Putnam County,
In 2004, about 90 migrating elk drowned after attempting to cross thin ice on the Mores Creek arm of Lucky Peak Lake upstream of the Highway 21 bridge. To better understand the depths over a range of reservoir pool elevations in the Mores Creek Arm, the U.S. Geological Survey, in cooperation with the Lucky Peak Power Plant Project, conducted high-resolution multibeam echosounder (MBES) bathymetric surveys on the Mores Creek arm on Lucky Peak Lake. The MBES data will assist reservoir managers and wildlife biologists with regulating reservoir water surface elevations (WSE) to support successful big game migration across Mores Creek on Lucky Peak Lake. Data collection provided nearly 100 percent coverage of bed elevations...
Categories: Data;
Types: Downloadable,
Map Service,
OGC WFS Layer,
OGC WMS Layer,
OGC WMS Service,
Shapefile;
Tags: Boise,
GPS measurement,
Hypack,
Hysweep,
ID,
Predictions of raven occurrence in the absence of anthropogenic environmental effects. Raven point counts were related to landscape covariates using Bayesian hierarchical occupancy models and the means of the posterior distributions for relevant effects were used to generate the predictions.
Categories: Data;
Types: ArcGIS REST Map Service,
ArcGIS Service Definition,
Downloadable,
Map Service;
Tags: Great Basin,
biota,
geographic information systems (GIS),
geospatial analysis,
habitat alteration,
This dataset is the output of a python script/ArcGIS model that identifes dikes as having a difference in elevation above a certain threshold. If the elevation difference was below a certain threshold the area was not considered a dike; however, if the difference in elevation between two points was significantly high then the area was marked as a dike. Areas continuous with eachother were considered part of the same dike. Post processing occured. Users examined the data output, comparing the proposed dike locations to aerial imagery, flowline data, and the DEM. Dikes that appeared to be false positives were deleted from the data set.
Categories: Data;
Types: Citation,
Downloadable,
Map Service,
OGC WFS Layer,
OGC WMS Layer,
Shapefile;
Tags: Great Lakes,
LIDAR,
Lake Erie,
biogeography,
coastal ecosystems,
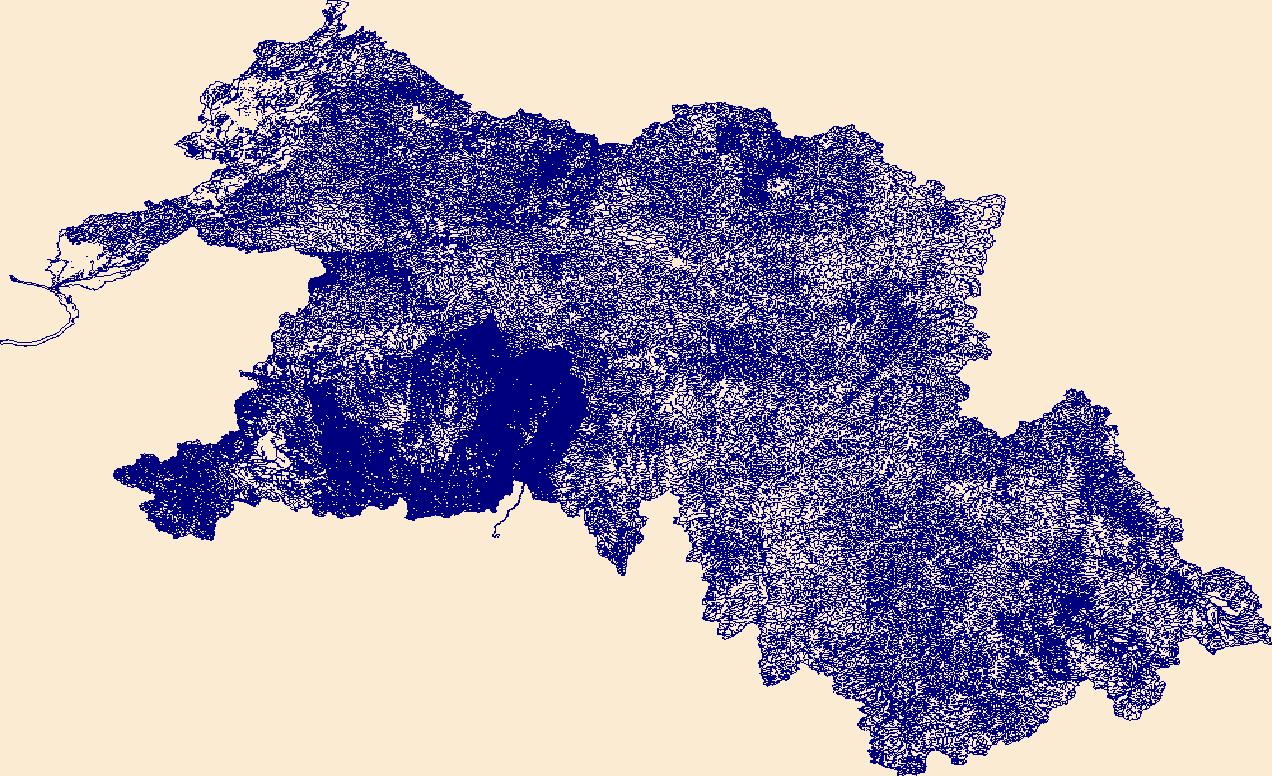
The High Resolution National Hydrography Dataset Plus (NHDPlus HR) is an integrated set of geospatial data layers, including the best available National Hydrography Dataset (NHD), the 10-meter 3D Elevation Program Digital Elevation Model (3DEP DEM), and the National Watershed Boundary Dataset (WBD). The NHDPlus HR combines the NHD, 3DEP DEMs, and WBD to create a stream network with linear referencing, feature naming, "value added attributes" (VAAs), elevation-derived catchments, and other features for hydrologic data analysis. The stream network with linear referencing is a system of data relationships applied to hydrographic systems so that one stream reach "flows" into another and "events" can be tied to and traced...
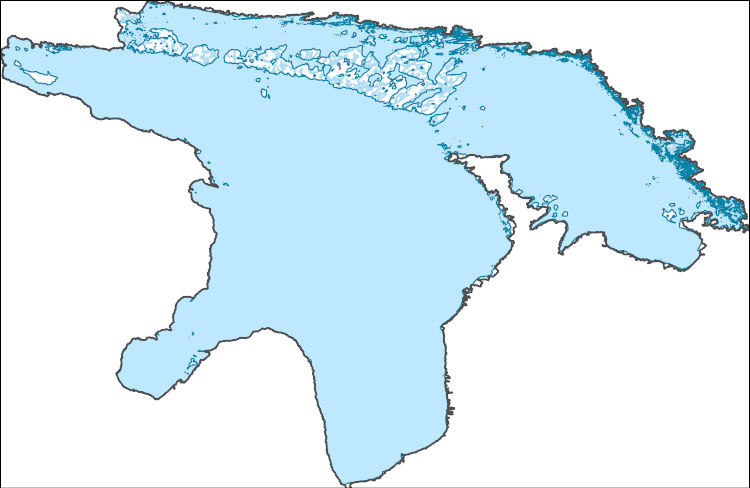
The High Resolution National Hydrography Dataset Plus (NHDPlus HR) is an integrated set of geospatial data layers, including the best available National Hydrography Dataset (NHD), the 10-meter 3D Elevation Program Digital Elevation Model (3DEP DEM), and the National Watershed Boundary Dataset (WBD). The NHDPlus HR combines the NHD, 3DEP DEMs, and WBD to create a stream network with linear referencing, feature naming, "value added attributes" (VAAs), elevation-derived catchments, and other features for hydrologic data analysis. The stream network with linear referencing is a system of data relationships applied to hydrographic systems so that one stream reach "flows" into another and "events" can be tied to and traced...
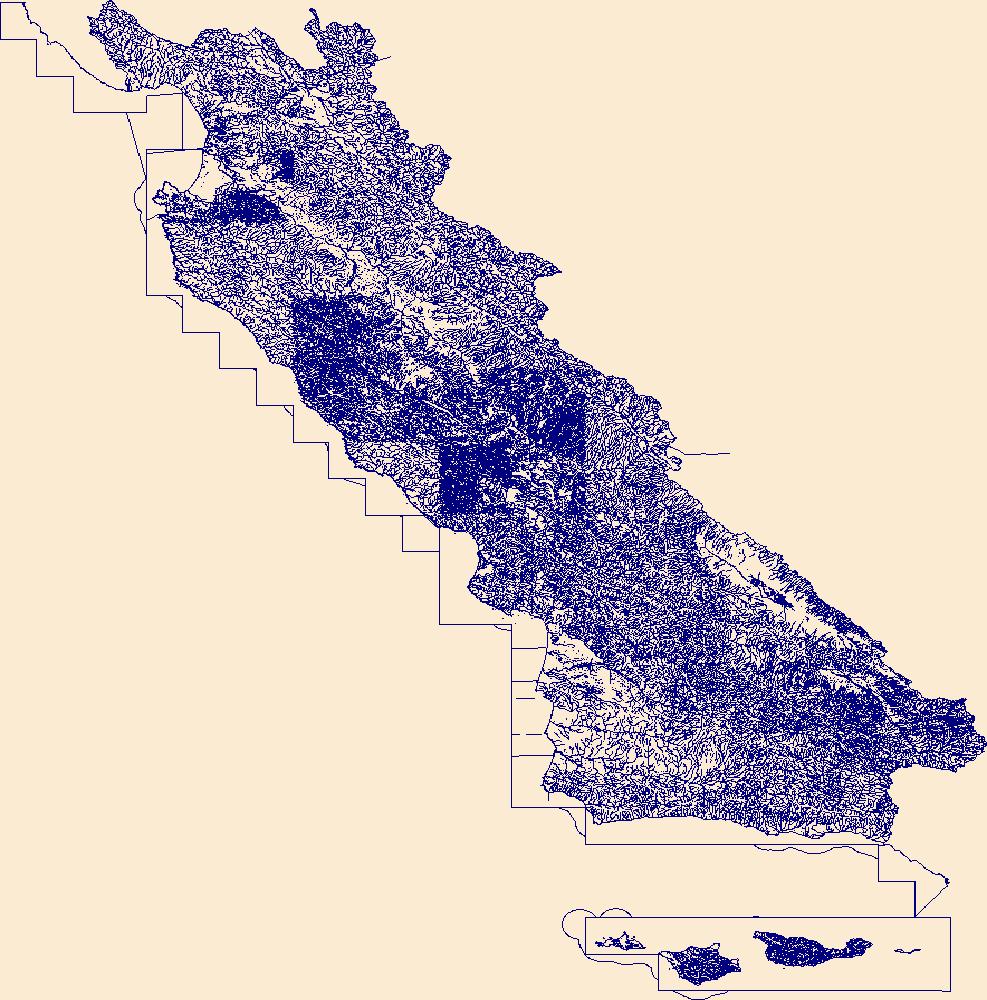
The High Resolution National Hydrography Dataset Plus (NHDPlus HR) is an integrated set of geospatial data layers, including the best available National Hydrography Dataset (NHD), the 10-meter 3D Elevation Program Digital Elevation Model (3DEP DEM), and the National Watershed Boundary Dataset (WBD). The NHDPlus HR combines the NHD, 3DEP DEMs, and WBD to create a stream network with linear referencing, feature naming, "value added attributes" (VAAs), elevation-derived catchments, and other features for hydrologic data analysis. The stream network with linear referencing is a system of data relationships applied to hydrographic systems so that one stream reach "flows" into another and "events" can be tied to and traced...
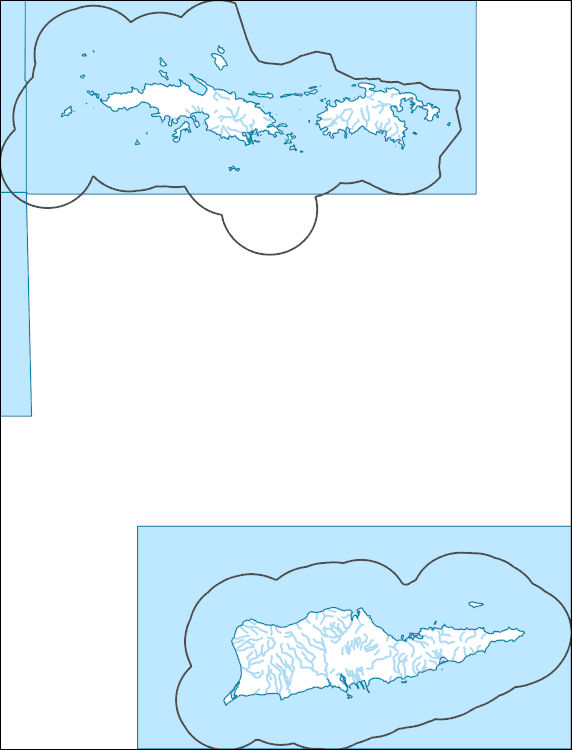
The High Resolution National Hydrography Dataset Plus (NHDPlus HR) is an integrated set of geospatial data layers, including the best available National Hydrography Dataset (NHD), the 10-meter 3D Elevation Program Digital Elevation Model (3DEP DEM), and the National Watershed Boundary Dataset (WBD). The NHDPlus HR combines the NHD, 3DEP DEMs, and WBD to create a stream network with linear referencing, feature naming, "value added attributes" (VAAs), elevation-derived catchments, and other features for hydrologic data analysis. The stream network with linear referencing is a system of data relationships applied to hydrographic systems so that one stream reach "flows" into another and "events" can be tied to and traced...
The High Resolution National Hydrography Dataset Plus (NHDPlus HR) is an integrated set of geospatial data layers, including the best available National Hydrography Dataset (NHD), the 10-meter 3D Elevation Program Digital Elevation Model (3DEP DEM), and the National Watershed Boundary Dataset (WBD). The NHDPlus HR combines the NHD, 3DEP DEMs, and WBD to create a stream network with linear referencing, feature naming, "value added attributes" (VAAs), elevation-derived catchments, and other features for hydrologic data analysis. The stream network with linear referencing is a system of data relationships applied to hydrographic systems so that one stream reach "flows" into another and "events" can be tied to and traced...
|

|
