Filters: Tags: Kern County (X)
848 results (84ms)|
Filters
Date Range
Extensions Types
Contacts
Categories Tag Types
|
Layered geospatial PDF 7.5 Minute Quadrangle Map. Layers of geospatial data include orthoimagery, roads, grids, geographic names, elevation contours, hydrography, and other selected map features. This map is derived from GIS (geospatial information system) data. It represents a repackaging of GIS data in traditional map form, not creation of new information. The geospatial data in this map are from selected National Map data holdings and other government sources.
This digital dataset contains historical geochemical and other information for 481 samples of produced water (PW) from 408 sites in the Edison, Mountain View, and Ant Hill Oil Fields in Kern County, California. Produced water is a term used in the oil industry to describe water that is produced from oil wells as a byproduct along with the oil and gas. The locations from which these historical samples have been collected include 199 wells, 67 sumps, 43 storage tanks (not associated with a specific well), and 104 unidentifiable sample sources which could not be classified because of insufficient information. The wells include 176 sites identifiable by an API (American Petroleum Institute) number and 23 sites for which...
Categories: Data;
Tags: California,
Kern County,
environment,
geochemistry,
geoscientificInformation,
The California State Water Resources Control Board (State Water Board) initiated the Oil and Gas Regional Monitoring Program (RMP) to assess effects of oil and gas development on groundwater designated for any beneficial use. The U.S. Geological Survey (USGS) is the technical lead in conducting the RMP through the California Oil, Gas, and Groundwater (COGG) Program, working in cooperation with the State Water Board, and in partnership with other State and local agencies. The USGS collected and analyzed groundwater, surface water, and associated quality control (QC) samples in the Poso Creek Oil Field study area during February 2020-December 2021. Groundwater samples were collected from eleven irrigation, two domestic,...
Passive seismic data collection was done northwest of the Air Force Research Laboratory (AFRL) at Edwards Air Force Base using the horizontal-to-vertical spectral ratio (HVSR) technique. HVSR surveys were done at 43 locations between May and September 2018 to refine the understanding of the bedrock-alluvial aquifer transition zone downgradient from the AFRL. Specifically, the data were collected to help determine the depth to bedrock. The HVSR method is a passive seismic technique that uses a three-component seismometer to measure the vertical and horizontal components of ambient seismic noise. Seismic noise in the range of ~0.1 to 1 Hertz (Hz) is caused by ocean waves, large regional storms, and tectonic sources....
Categories: Data;
Tags: Antelope-Fremont Valleys,
Boron,
California,
Edwards Air Force Base,
Kern County,
The U.S. Geological Survey (USGS) in cooperation with the California State Water Resources Control Board collected produced water samples for analysis of volatile organic compounds (VOCs) in the eight California oil fields of Fruitvale, Lost Hills, North Belridge, Orcutt, Placerita, South Belridge, Midway-Sunset, and Buena Vista from 2016 to 2020. Sampled sites included oil wells; injectate from tanks, pipelines, and injection wells where produced water from many wells, after removal of oil, is stored or transported prior to underground injection; integrated produced water from many oil wells collected from pipelines before oil removal; and surface disposal ponds where produced water, after removal of oil, is disposed...
Layered geospatial PDF 7.5 Minute Quadrangle Map. Layers of geospatial data include orthoimagery, roads, grids, geographic names, elevation contours, hydrography, and other selected map features. This map is derived from GIS (geospatial information system) data. It represents a repackaging of GIS data in traditional map form, not creation of new information. The geospatial data in this map are from selected National Map data holdings and other government sources.
Layered geospatial PDF 7.5 Minute Quadrangle Map. Layers of geospatial data include orthoimagery, roads, grids, geographic names, elevation contours, hydrography, and other selected map features. This map is derived from GIS (geospatial information system) data. It represents a repackaging of GIS data in traditional map form, not creation of new information. The geospatial data in this map are from selected National Map data holdings and other government sources.
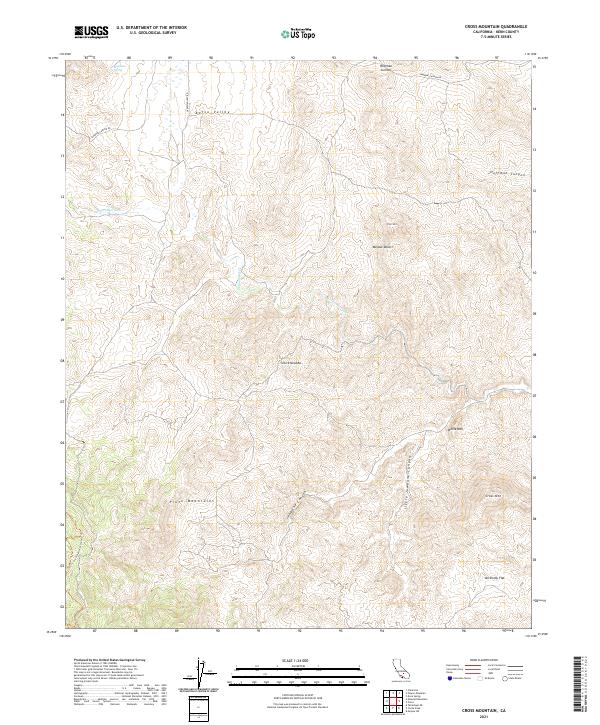
Layered geospatial PDF 7.5 Minute Quadrangle Map. Layers of geospatial data include orthoimagery, roads, grids, geographic names, elevation contours, hydrography, and other selected map features. This map is derived from GIS (geospatial information system) data. It represents a repackaging of GIS data in traditional map form, not creation of new information. The geospatial data in this map are from selected National Map data holdings and other government sources.
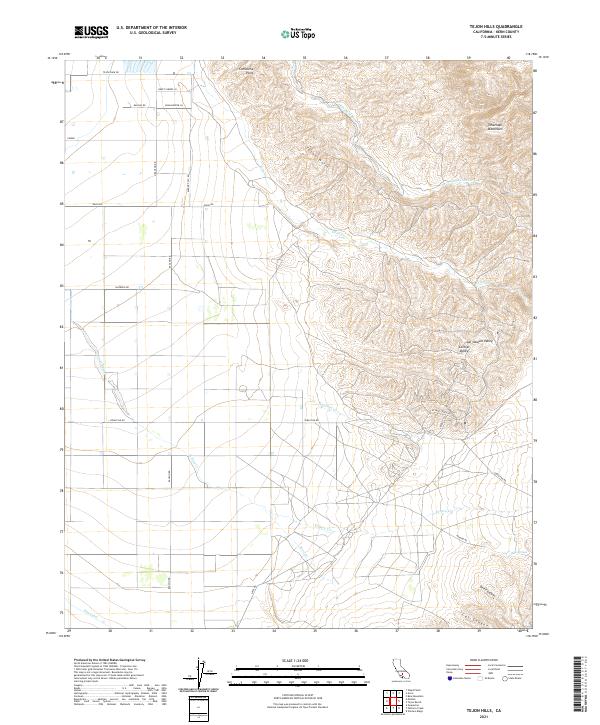
Layered geospatial PDF 7.5 Minute Quadrangle Map. Layers of geospatial data include orthoimagery, roads, grids, geographic names, elevation contours, hydrography, and other selected map features. This map is derived from GIS (geospatial information system) data. It represents a repackaging of GIS data in traditional map form, not creation of new information. The geospatial data in this map are from selected National Map data holdings and other government sources.
Layered geospatial PDF 7.5 Minute Quadrangle Map. Layers of geospatial data include orthoimagery, roads, grids, geographic names, elevation contours, hydrography, and other selected map features. This map is derived from GIS (geospatial information system) data. It represents a repackaging of GIS data in traditional map form, not creation of new information. The geospatial data in this map are from selected National Map data holdings and other government sources.
Layered geospatial PDF 7.5 Minute Quadrangle Map. Layers of geospatial data include orthoimagery, roads, grids, geographic names, elevation contours, hydrography, and other selected map features. This map is derived from GIS (geospatial information system) data. It represents a repackaging of GIS data in traditional map form, not creation of new information. The geospatial data in this map are from selected National Map data holdings and other government sources.
Layered geospatial PDF 7.5 Minute Quadrangle Map. Layers of geospatial data include orthoimagery, roads, grids, geographic names, elevation contours, hydrography, and other selected map features. This map is derived from GIS (geospatial information system) data. It represents a repackaging of GIS data in traditional map form, not creation of new information. The geospatial data in this map are from selected National Map data holdings and other government sources.
Layered geospatial PDF 7.5 Minute Quadrangle Map. Layers of geospatial data include orthoimagery, roads, grids, geographic names, elevation contours, hydrography, and other selected map features. This map is derived from GIS (geospatial information system) data. It represents a repackaging of GIS data in traditional map form, not creation of new information. The geospatial data in this map are from selected National Map data holdings and other government sources.

These data were released prior to the October 1, 2016 effective date for the USGS’s policy dictating the review, approval, and release of scientific data as referenced in USGS Survey Manual Chapter 502.8 Fundamental Science Practices: Review and Approval of Scientific Data for Release. Recharge in the Death Valley regional ground-water flow system (DVRFS) was estimated from net infiltration simulated by Hevesi and others (2003) using a deterministic mass-balance method. Hevesi and others (2003) estimated potential recharge for the DVRFS, an approximately 100,000 square- kilometer region of southern Nevada and California, using the net-infiltration model, INFILv3. Net infiltration, estimated on a cell-by-cell basis,...

These data were released prior to the October 1, 2016 effective date for the USGS’s policy dictating the review, approval, and release of scientific data as referenced in USGS Survey Manual Chapter 502.8 Fundamental Science Practices: Review and Approval of Scientific Data for Release. This digital dataset defines the spring 1961 water-table altitude for the California's Central Valley. It was used to initiate the water-level altitudes for the upper zones of the transient hydrologic model of the Central Valley flow system. The Central Valley encompasses an approximate 50,000 square-kilometer region of California. The complex hydrologic system of the Central Valley is simulated using the USGS numerical modeling...

These data were released prior to the October 1, 2016 effective date for the USGS’s policy dictating the review, approval, and release of scientific data as referenced in USGS Survey Manual Chapter 502.8 Fundamental Science Practices: Review and Approval of Scientific Data for Release. This digital dataset defines the depth of the Corcoran Clay Member of the Tulare Formation. The complex hydrologic system of the Central Valley is simulated using the USGS numerical modeling code MODFLOW-FMP (Schmid and others, 2006b). This simulation is referred to here as the Central Valley Hydrologic Model (CVHM) (Faunt, 2009). Utilizing MODFLOW-FMP, the CVHM simulates groundwater and surface-water flow, irrigated agriculture,...

These data were released prior to the October 1, 2016 effective date for the USGS’s policy dictating the review, approval, and release of scientific data as referenced in USGS Survey Manual Chapter 502.8 Fundamental Science Practices: Review and Approval of Scientific Data for Release. Recharge in the Death Valley regional ground-water flow system (DVRFS) was estimated from net infiltration simulated by Hevesi and others (2003) using a deterministic mass-balance method. Hevesi and others (2003) estimated potential recharge for the DVRFS, an approximately 100,000 square-kilometer region of southern Nevada and California, using the net-infiltration model, INFILv3. Net infiltration, estimated on a cell-by-cell basis,...

These data were released prior to the October 1, 2016 effective date for the USGS’s policy dictating the review, approval, and release of scientific data as referenced in USGS Survey Manual Chapter 502.8 Fundamental Science Practices: Review and Approval of Scientific Data for Release. This digital dataset contains the surface-water network for the Central Valley Hydrologic Model (CVHM). The Central Valley encompasses an approximate 50,000-square-kilometer region of California. The complex hydrologic system of the Central Valley is simulated using the USGS numerical modeling code MODFLOW-FMP (Schmid and others, 2006). This simulation is referred to here as the CVHM (Faunt, 2009). Utilizing MODFLOW-FMP, the CVHM...

These data were released prior to the October 1, 2016 effective date for the USGS’s policy dictating the review, approval, and release of scientific data as referenced in USGS Survey Manual Chapter 502.8 Fundamental Science Practices: Review and Approval of Scientific Data for Release. This digital dataset defines the model grid and altitudes of the top of the 10 model layers and base of the model simulated in the transient hydrologic model of the Central Valley flow system. The Central Valley encompasses an approximate 50,000 square-kilometer region of California. The complex hydrologic system of the Central Valley is simulated using the USGS numerical modeling code MODFLOW-FMP (Schmid and others, 2006), which...

These data were released prior to the October 1, 2016 effective date for the USGS’s policy dictating the review, approval, and release of scientific data as referenced in USGS Survey Manual Chapter 502.8 Fundamental Science Practices: Review and Approval of Scientific Data for Release. This data release has been superseded by Altitudes of the top of model layers for the transient ground-water flow model, Death Valley regional ground-water flow system, Nevada and California (also available at https://doi.org/10.5066/p9sctze0) This digital data set defines the altitudes of the tops of 16 model layers simulated in the Death Valley regional ground-water flow system (DVRFS) transient flow model. The area simulated...
|

|
