Filters: Tags: LAND COVER (X)
815 results (84ms)|
Filters
Date Range
Extensions (Less)
Types (Less)
Contacts (Less)
Categories (Less)
Tag Types
|
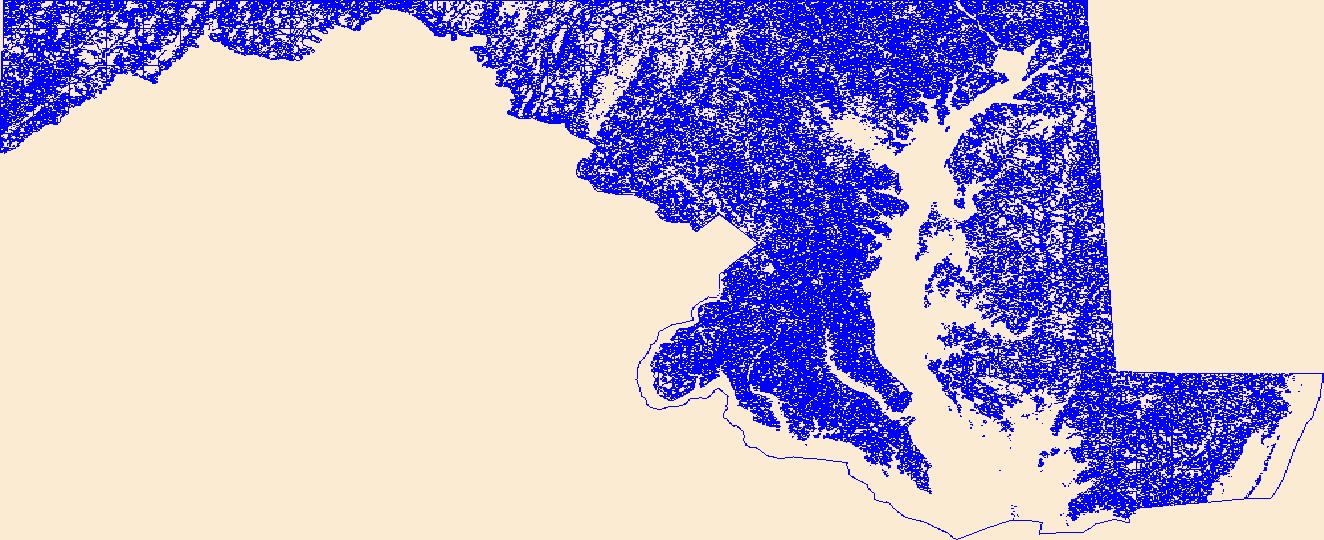
This data set presents attributes of floodplain ecosystem characteristics including floodplain soil denitrification, floodplain soil biogeochemistry, floodplain vegetation, floodplain sedimentation, floodplain and channel morphometry, stream discharge and water quality, floodplain climate, floodplain physiographic region, and catchment land cover. Attributes are associated with 18 floodplains of the Chesapeake Bay watershed. For many of these attributes, mean values are summaries of multiple measurements made within each floodplain site.
Categories: Data;
Tags: Maryland,
Pennsylvania,
USGS Science Data Catalog (SDC),
Virginia,
West Virginia,
This dataset contains a projection of land use and land cover for the conterminous United States for the period 2001 - 2061. This projection used the USGS's LUCAS (Land Use and Carbon Scenario Simulator) model to project a business as usual scenario of land cover and land use change. By running the LUCAS model on the USGS's YETI high performance computer and parallelizing the computation, we ran 100 Monte Carlo simulations based on empirically observed rates of change at a relatively fine scale (270m). We sampled from multiple observed rates of change at the county level to introduce heterogeneity into the Monte Carlo simulations. Using this approach allowed the model to project different outcomes that were summarized...
This data file contains a list of journal articles found in a recent search for research relevant to studying landscape perceptions. We collected all peer reviewed academic articles containing the keywords “landscape” and “perception” on the web of science resulting in 3497 records. To eliminate studies not directly addressing landscape perception we filtered out medical journal articles (n=1211). We also chose to limit our assessment to journals directly concerned with the landscape perception topic, omitting those with fewer than 5 articles pertaining to these keywords (n=1044). The abstract and title of the remaining articles (n=1242) were further scanned to discard irrelevant studies and evaluate specific methods...
Categories: Data;
Tags: Geography,
Land Use Change,
USGS Science Data Catalog (SDC),
World,
land cover,
Geospatial data that is a derivative land cover product depicting woodland on topographic maps.
Geospatial data that is a derivative land cover product depicting woodland on topographic maps.
Geospatial data that is a derivative land cover product depicting woodland on topographic maps.
Geospatial data that is a derivative land cover product depicting woodland on topographic maps.
Geospatial data that is a derivative land cover product depicting woodland on topographic maps.
The National Park Service (NPS), in conjunction with the Biological Resources Division (BRD) of the U.S. Geological Survey (USGS), has implemented a program to "develop a uniform hierarchical vegetation methodology" at a national level. The program will also create a geographic information system (GIS) database for the parks under its management. The purpose of the data is to document the state of vegetation within the NPS service area during the 1990's, thereby providing a baseline study for further analysis at the Regional or Service-wide level. The vegetation at Devils Tower National Monument was mapped using 1:16,000 scale U.S. Forest Service Color Aerial Photography acquired July 29, 1993. The mapping classification...
The vegetation spatial database coverage (vegetation map) is a product of the Effigy Mounds National Monument Vegetation Mapping Project, USGS-NPS Vegetation Mapping Program (VMP). The U.S. Geological Survey (USGS) Upper Midwest Environmental Sciences Center (UMESC) in La Crosse, Wisconsin, and the Minneapolis Office of NatureServe in Minneapolis, Minnesota, have completed mapping and classification of existing plant communities of Effigy Mounds National Monument (EFMO) and extended surroundings. Photointerpreters, ecologists, and botanists collaborated to describe National Vegetation Classification System (NVCS) plant communities (associations) and determine how best to map them using aerial photographs. --- Two...
The vegetation units on this map were determined through the stereoscopic interpretation of aerial photographs supported by field sampling and ecological analysis. The vegetation boundaries were identified on the photographs by means of the photographic signature and collateral information on slope, hydrology, geography, and vegetation in accordance with the Standardized National Vegetation Classification System (October 1995). The mapped vegetation reflects conditions that existed during the specific year and season that the aerial photographs were taken. There is a margin of error inherent in the use of aerial photographs. Therefore, a detailed ground and historical analysis of a single site may result in a revision...
Geospatial data that is a derivative land cover product depicting woodland on topographic maps.
Geospatial data that is a derivative land cover product depicting woodland on topographic maps.
Gap Analysis Program (GAP) Landcover, restricted to original WLCI boundary (effective 2007-May 2009)
This data contains land cover (mostly vegetation types) for the entire state of Wyoming at 1:100,000 scale. Attribute fields describe primary and secondary land cover, crown closure, wetlands, disturbance and other important land cover types occuring within the polygon. Only the fields for primary land cover and percentage of each polygon occupied by that land cover are complete in the coverage, but other attribute fields are populated when information was available.
Categories: Data;
Types: Downloadable,
Map Service,
OGC WFS Layer,
OGC WMS Layer,
Shapefile;
Tags: biotic,
land cover,
natural,
plant,
urban,
This geospatial database covers vegetation land cover and land use for Wind Cave National Park and surrounding areas and is authorized as part of the USGS/NPS Vegetation Mapping Program http://www.usgs.gov/core_science_systems/csas/vip/index.html. The program is administered by the Biological Resources Division (BRD) of the United States Geological Survey (USGS). This mapping effort was performed by the US Bureau of Reclamation's (USBR) Remote Sensing and GIS Group, Technical Service Center, Denver, CO. The vegetation mapping program is part of a larger Inventory and Monitoring (I&M) program started by the National Park Service (NPS) http://science.nature.nps.gov/im/. I&M goals are, among others, to map the vegetation...
Geospatial data that is a derivative land cover product depicting woodland on topographic maps.
Vegetation at HUTR was mapped and classified by a combination of plot data, field visits and photo interpretation. Aerial photographs from September 14th, 2003 were used during the photo interpretation process. Field data used to aid in the assignment of map labels was collected in August of 2006. The protocols and standards used are those for small parks and are described in the NPS/BRD program documents (National Mapping Program Field Methods for Vegetation Mapping (1994a) for small parks (section 5.1). BOR was contracted by the Southern Colorado Plateau Network in 2005 to map approximately 1,639 acres (~ 663 ha) of Hubbell Trading Post National Historic Site and environs.Vegetation mapping for HUTR encompassed...
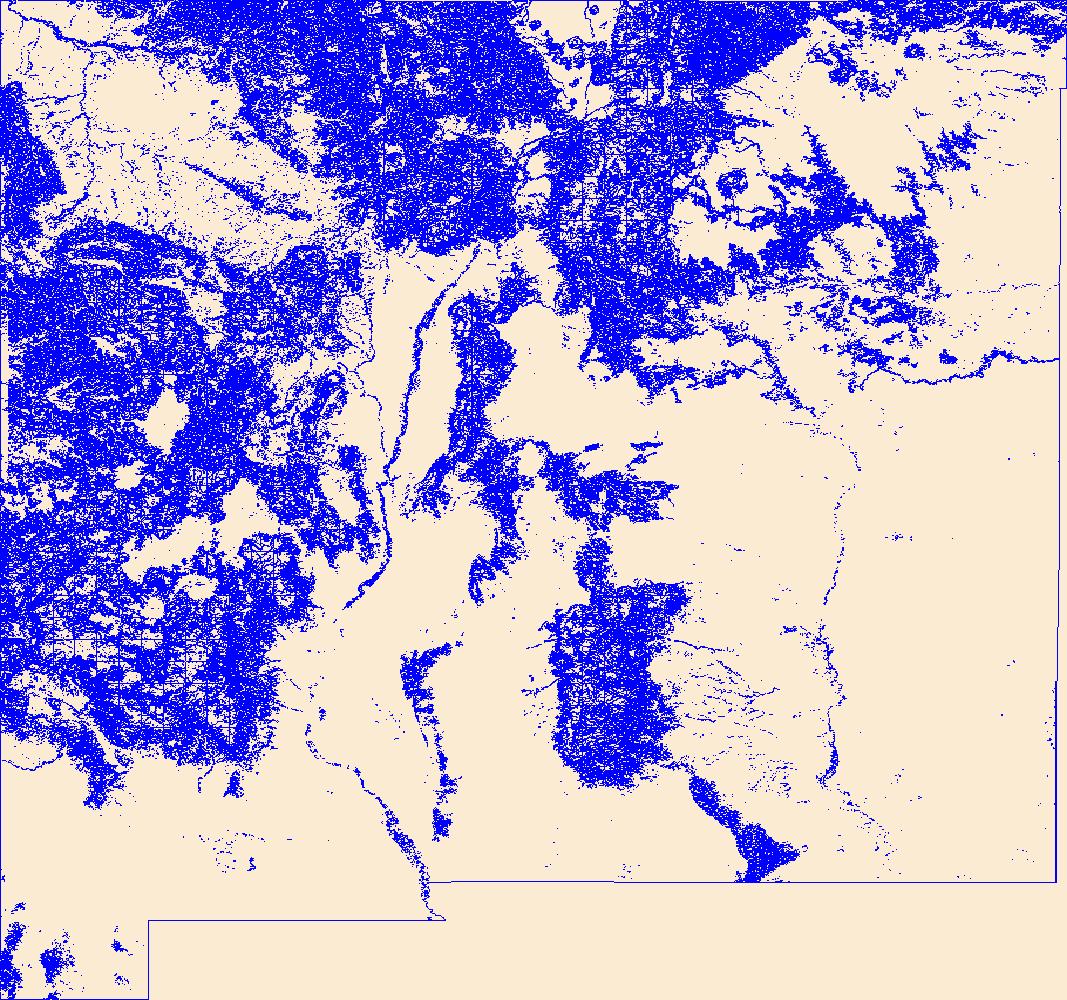
This raster file represents classification and mapping results for priority area 1 of the Cody Region and Yellowstone National Park land cover remote sensing project. Extensive field collected reference data describing the range of plant communities and habitat types comprising the Bighorn Basin have been analyzed to produce a classification of land cover types based on the Wyoming Game and Fish Department (WGFD) Wildlife Observation System (WOS). Corresponding land cover classes were subsequently spatially modeled using a non-parametric Classification and Regression Tree (CART) algorithm that integrated both spectral data from Landsat Thematic Mapper satellite imagery and a variety of ancillary environmental data...
Categories: Data;
Types: Downloadable;
Tags: Absaroka,
Bighorn Basin,
Land Cover,
Land Use,
Landcover,
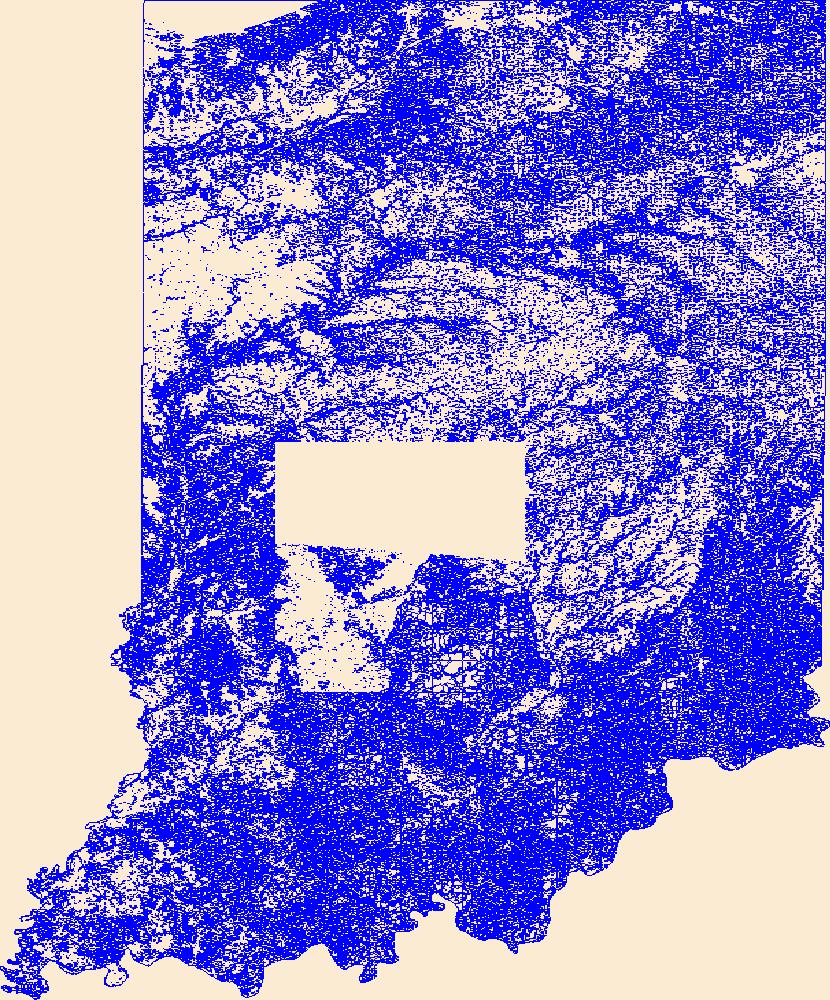
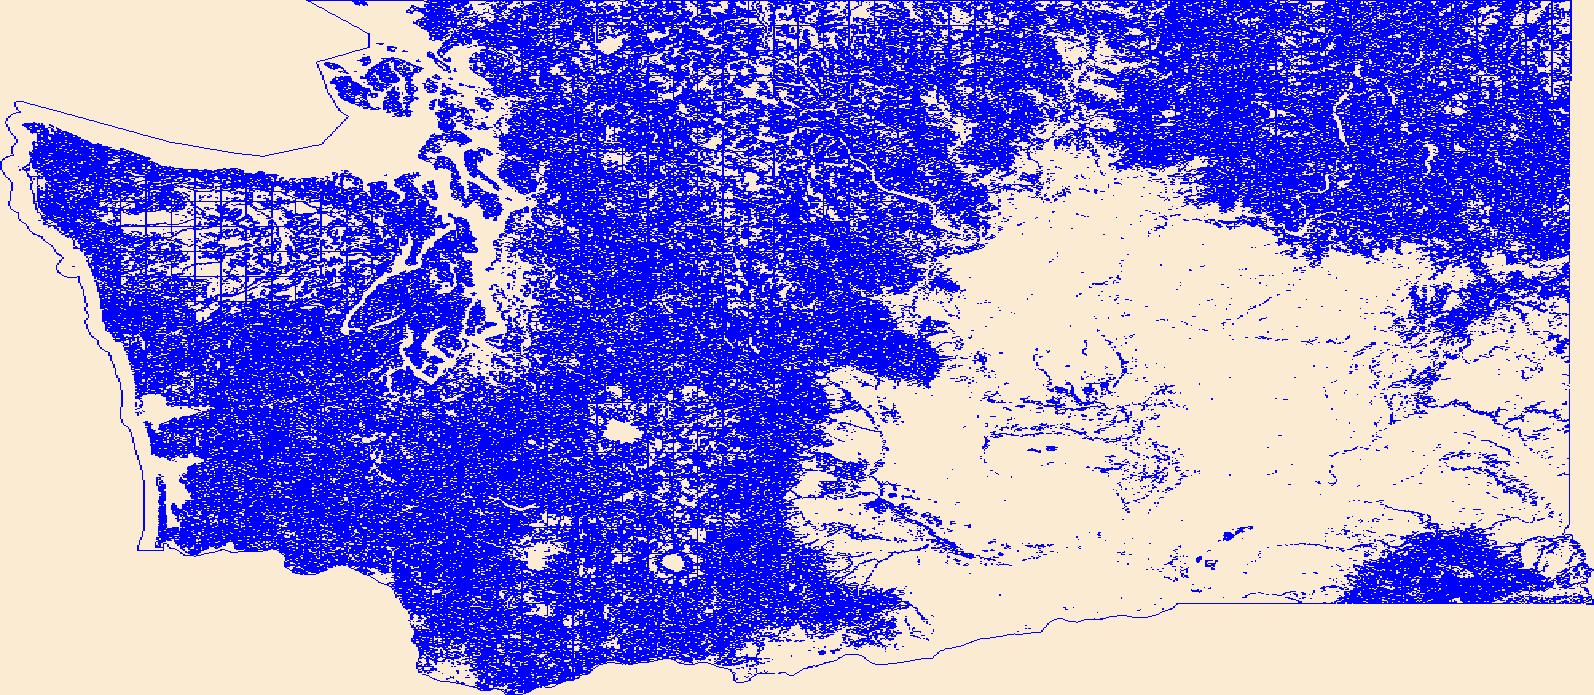
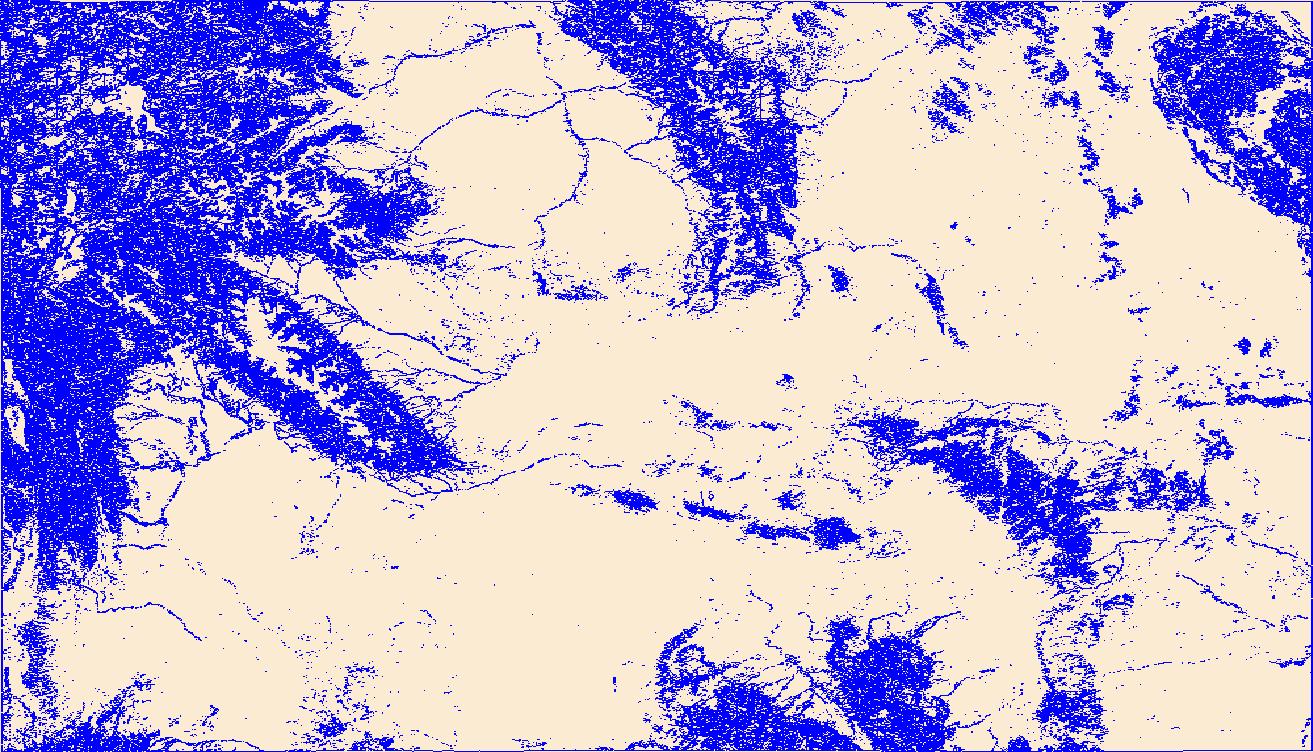
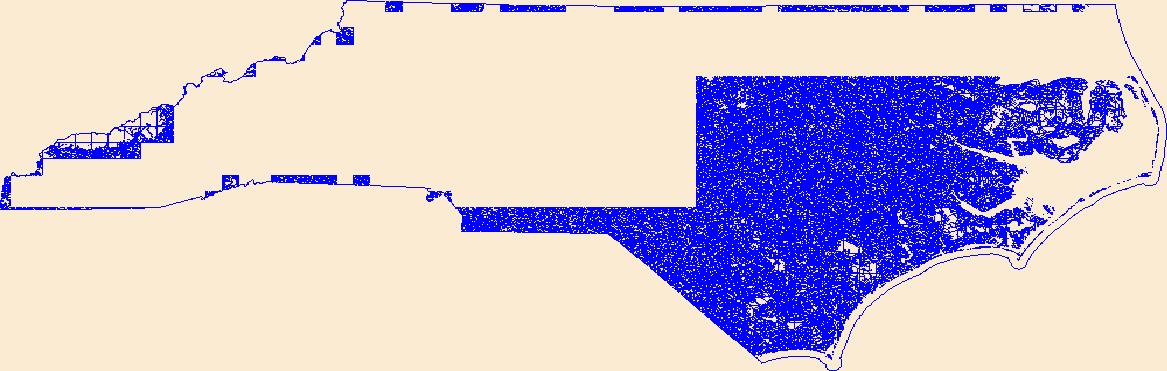
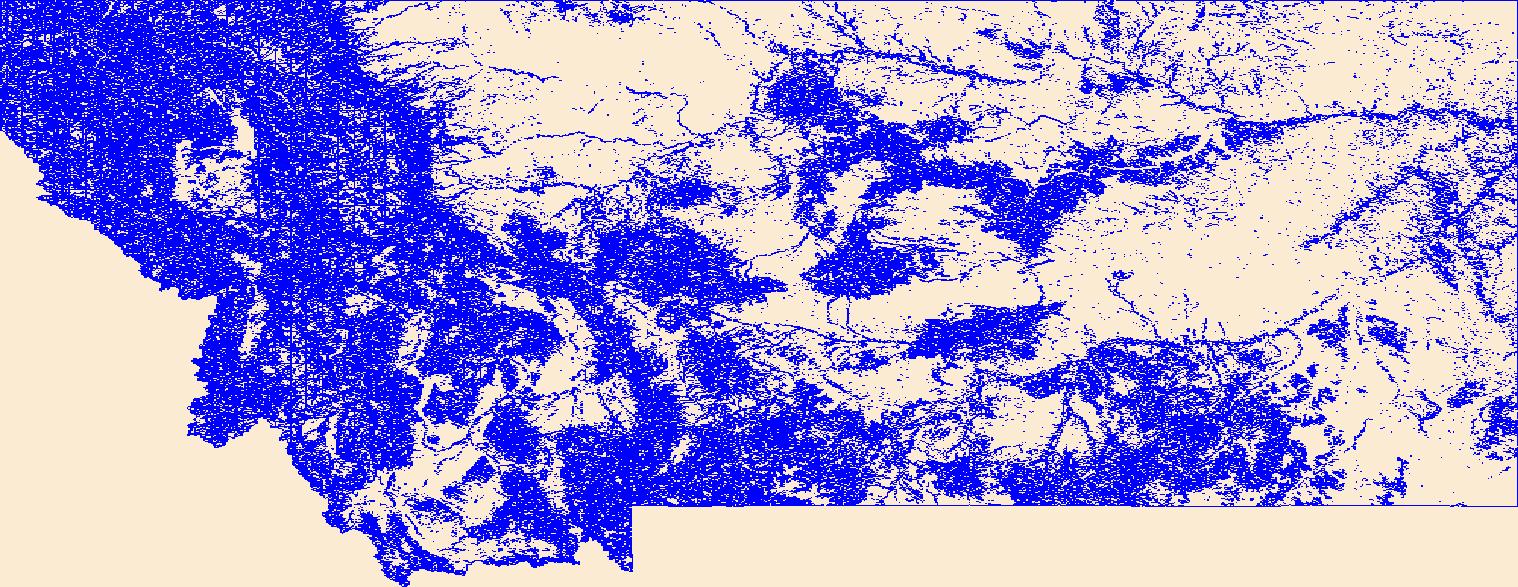
These data can be used in a geographic information system (GIS) for any number of purposes such as assessing wildlife habitat, water quality, pesticide runoff, land use change, etc. The State data sets are provided with a 300 meter buffer beyond the State border to faciliate combining the State files into larger regions. The user must have a firm understanding of how the datasets were compiled and the resulting limitations of these data. The National Land Cover Dataset was compiled from Landsat satellite TM imagery (circa 1992) with a spatial resolution of 30 meters and supplemented by various ancillary data (where available). The analysis and interpretation of the satellite imagery was conducted using very large,...
|

|
