Filters: Tags: Livingston County (X)
448 results (411ms)|
Filters
Date Range
Extensions Types Contacts
Categories Tag Types
|
Layered geospatial PDF 7.5 Minute Quadrangle Map. Layers of geospatial data include orthoimagery, roads, grids, geographic names, elevation contours, hydrography, and other selected map features. This map is derived from GIS (geospatial information system) data. It represents a repackaging of GIS data in traditional map form, not creation of new information. The geospatial data in this map are from selected National Map data holdings and other government sources.
Types: Citation;
Tags: 7.5 x 7.5 minute,
Downloadable Data,
EarthCover,
Geospatial PDF,
Geospatial PDF,
Layered geospatial PDF 7.5 Minute Quadrangle Map. Layers of geospatial data include orthoimagery, roads, grids, geographic names, elevation contours, hydrography, and other selected map features. This map is derived from GIS (geospatial information system) data. It represents a repackaging of GIS data in traditional map form, not creation of new information. The geospatial data in this map are from selected National Map data holdings and other government sources.
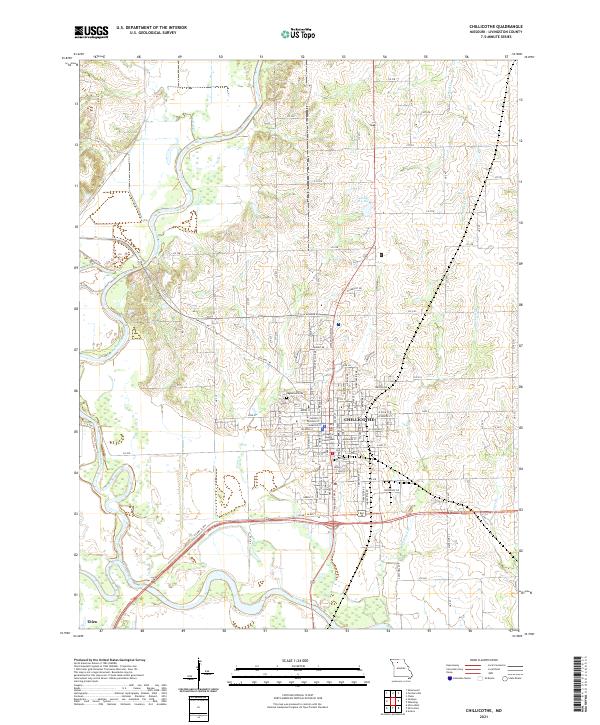
Layered geospatial PDF 7.5 Minute Quadrangle Map. Layers of geospatial data include orthoimagery, roads, grids, geographic names, elevation contours, hydrography, and other selected map features. This map is derived from GIS (geospatial information system) data. It represents a repackaging of GIS data in traditional map form, not creation of new information. The geospatial data in this map are from selected National Map data holdings and other government sources.
Layered geospatial PDF 7.5 Minute Quadrangle Map. Layers of geospatial data include orthoimagery, roads, grids, geographic names, elevation contours, hydrography, and other selected map features. This map is derived from GIS (geospatial information system) data. It represents a repackaging of GIS data in traditional map form, not creation of new information. The geospatial data in this map are from selected National Map data holdings and other government sources.
Layered geospatial PDF 7.5 Minute Quadrangle Map. Layers of geospatial data include orthoimagery, roads, grids, geographic names, elevation contours, hydrography, and other selected map features. This map is derived from GIS (geospatial information system) data. It represents a repackaging of GIS data in traditional map form, not creation of new information. The geospatial data in this map are from selected National Map data holdings and other government sources.
This folder contains the raw and processed TEM data and inverted soundings showing resistivity (in ohm-m) with depth for all survey sites that were part of transect 3. In October and November 2016-2017, transient electromagnetic (TEM) data, also called time domain electromagnetic (TDEM) surveys, were acquired at 120 locations in the Genesee Valley, Livingston County, in New York, in order to characterize the subsurface resistivity structure in support of a U.S. Geological Survey groundwater investigation. The TEM data were collected as part of a project to evaluate geophysical methods to characterize the valley-fill sediments, underlying bedrock, and salinity of the subsurface. TEM data were collected using an ABEM...
In October and November of 2016 and 2017, the U.S. Geological Survey collected horizontal-to-vertical spectral ratio (HVSR) data at 104 sites in the Genesee Valley, Livingston County, New York as part of a saline-groundwater investigation in cooperation with the New York State Department of Environmental Resources. The HVSR technique, commonly referred to as the passive-seismic method, is used to estimate the thickness of unconsolidated sediments and the depth to bedrock (Lane and others, 2008). The passive-seismic method uses a single, broad-band three-component (two horizontal and one vertical) seismometer to record ambient seismic noise. In areas that have a strong acoustic contrast between the bedrock and overlying...
Layered geospatial PDF 7.5 Minute Quadrangle Map. Layers of geospatial data include orthoimagery, roads, grids, geographic names, elevation contours, hydrography, and other selected map features. This map is derived from GIS (geospatial information system) data. It represents a repackaging of GIS data in traditional map form, not creation of new information. The geospatial data in this map are from selected National Map data holdings and other government sources.
The development and the generation of the dataset that is published through this data release, is based on the results and findings of the report mentioned here: Prokopec, J.G., 2018, Hydraulic modeling and flood-inundation mapping for the Huron River and Ore Lake Tributary, Livingston County, Michigan: U.S. Geological Survey Scientific Investigations Report 2018-5048, https://doi.org/10.3133/sir20185048. The geospatial dataset contains final versions of the raster and vector geospatial data and its related metadata that are discussed in the report.
As part of the Great Lakes Restoration Initiative, the U.S. Department of Agriculture, Natural Resources Conservation Service; U.S. Environmental Protection Agency; and the U.S. Geological Survey (USGS) have partnered to evaluate the impacts of implementing agricultural conservation practices focused on nutrient management. Monitoring methods have been designed to allow for rapid assessment of water-quality changes in response to conservation efforts by focusing on subsurface-tile drainage and direct surface runoff from fields—the major pathways for nonpoint-source pollution to enter streams. Monitoring stations were established at the field edge that measured runoff volume and enabled the collection of samples...
Layered geospatial PDF 7.5 Minute Quadrangle Map. Layers of geospatial data include orthoimagery, roads, grids, geographic names, elevation contours, hydrography, and other selected map features. This map is derived from GIS (geospatial information system) data. It represents a repackaging of GIS data in traditional map form, not creation of new information. The geospatial data in this map are from selected National Map data holdings and other government sources.
Layered geospatial PDF 7.5 Minute Quadrangle Map. Layers of geospatial data include orthoimagery, roads, grids, geographic names, elevation contours, hydrography, and other selected map features. This map is derived from GIS (geospatial information system) data. It represents a repackaging of GIS data in traditional map form, not creation of new information. The geospatial data in this map are from selected National Map data holdings and other government sources.

The algorithms and input data included in this data release are used to interpret time-series data (water-table altitude, precipitation, snowmelt, and potential evapotranspiration) over an observation period to estimate model parameters of a State-Space Model (SSM) of vertical infiltration to the groundwater table. The SSM model is coupled with a Kalman Filter (KF) to estimate system states (water-table altitude and groundwater recharge) over the observation period. This SSM and KF model is formulated for one-dimensional vertical infiltration and includes preferential and diffuse flow through the unsaturated zone to the water table. The analysis was conducted to demonstrate the application of the SSM and KF model...
Layered geospatial PDF 7.5 Minute Quadrangle Map. Layers of geospatial data include orthoimagery, roads, grids, geographic names, elevation contours, hydrography, and other selected map features. This map is derived from GIS (geospatial information system) data. It represents a repackaging of GIS data in traditional map form, not creation of new information. The geospatial data in this map are from selected National Map data holdings and other government sources.
Layered geospatial PDF 7.5 Minute Quadrangle Map. Layers of geospatial data include orthoimagery, roads, grids, geographic names, elevation contours, hydrography, and other selected map features. This map is derived from GIS (geospatial information system) data. It represents a repackaging of GIS data in traditional map form, not creation of new information. The geospatial data in this map are from selected National Map data holdings and other government sources.
Layered geospatial PDF 7.5 Minute Quadrangle Map. Layers of geospatial data include orthoimagery, roads, grids, geographic names, elevation contours, hydrography, and other selected map features. This map is derived from GIS (geospatial information system) data. It represents a repackaging of GIS data in traditional map form, not creation of new information. The geospatial data in this map are from selected National Map data holdings and other government sources.
Layered geospatial PDF 7.5 Minute Quadrangle Map. Layers of geospatial data include orthoimagery, roads, grids, geographic names, elevation contours, hydrography, and other selected map features. This map is derived from GIS (geospatial information system) data. It represents a repackaging of GIS data in traditional map form, not creation of new information. The geospatial data in this map are from selected National Map data holdings and other government sources.
Layered geospatial PDF 7.5 Minute Quadrangle Map. Layers of geospatial data include orthoimagery, roads, grids, geographic names, elevation contours, hydrography, and other selected map features. This map is derived from GIS (geospatial information system) data. It represents a repackaging of GIS data in traditional map form, not creation of new information. The geospatial data in this map are from selected National Map data holdings and other government sources.
Layers of geospatial data include contours, boundaries, land cover, hydrography, roads, transportation, geographic names, structures, and other selected map features.
Types: Citation;
Tags: 7.5 x 7.5 minute,
7.5 x 7.5 minute,
Combined Vector,
Combined Vector,
Combined Vector,
Layers of geospatial data include contours, boundaries, land cover, hydrography, roads, transportation, geographic names, structures, and other selected map features.
|

|
