Filters: Tags: NAWQA (X)
397 results (41ms)|
Filters
Date Range
Extensions Types
Contacts
Categories Tag Types Tag Schemes |
This tabular data set represents annual average potential evapotranspiration values (millimeters) described in Wolock and McCabe (2017), compiled for the NHDPlus version 2 data suite (NHDPlusV2) for the conterminous United States for the years 2014 and 2015. Linkage of the potential evapotranspiration data with NHDPlusV2 is achieved through the common unique identifier COMID. The potential evapotranspiration values are estimated both for: 1) individual reach catchments and 2) reach catchments accumulated upstream through the river network. The reach catchment information characterizes data at the local scale, whereas the catchments accumulated through the river network characterize cumulative upstream conditions....
This tabular data set represents NLCD 2001 percent imperviousness in the 100 meter riparian buffer zones compiled for two spatial components of the NHDPlus version 2 data suite (NHDPlusv2) for the conterminous United States; 1) individual reach catchments and 2) reach catchments accumulated upstream through the river network. This dataset can be linked to the NHDPlus version 2 data suite by the unique identifier COMID. The source data is the "NLCD 2001 Percent Developed Imperviousness (2011 Edition, amended 2014)-National Geospatial Data Asset (NGDA) Land Use Land Cover" which was produced by the United States Geological Survey (Yang and others, 2011). Units are percent. Reach catchment information characterizes...
This tabular data set represents annual average runoff values (millimeters) described in Wolock and McCabe (2017), compiled for the NHDPlus version 2 data suite (NHDPlusV2) for the conterminous United States. Linkage of the runoff data with NHDPlusV2 is achieved through the common unique identifier COMID. The runoff values are estimated both for: 1) individual reach catchments and 2) reach catchments accumulated upstream through the river network. The reach catchment information characterizes data at the local scale, whereas the catchments accumulated through the river network characterize cumulative upstream conditions. The network-accumulated values are derived using two methods: 1) divergence routing and 2) total...
This tabular data set represents 30 year average (1961-1990) of maximum monthly precipitation in millimeters compiled for two spatial components of the NHDPlus version 2 data suite (NHDPlusv2) for the conterminous United States; 1) individual reach catchments and 2) reach catchments accumulated upstream through the river network. This dataset can be linked to the NHDPlus version 2 data suite by the unique identifier COMID. The source data for 30 year average (1961-1990) of maximum monthly precipitation was originally PRISM-based data, with some further enhancements by ClimateSource.com and then provided to the USGS by the Environmental Protection Agency (Ryan Hill, EPA, written commun., 2011). Units are millimeters...
This tabular data set represents the mean Julian year day of the year of the last freeze, from 30 years of record (1961-1990) compiled for two spatial components of the NHDPlus version 2 data suite (NHDPlusv2) for the conterminous United States; 1) individual reach catchments and 2) reach catchments accumulated upstream through the river network. This dataset can be linked to the NHDPlus version 2 data suite by the unique identifier COMID. The source data for the mean day of the year of a last freeze, from 30 years of record (1961-1990) was provided by the Environmental Protection Agency and is included with this data set (Ryan Hill, EPA, written commun., 2006). The values represent the Julian year day of the last...
This tabular data set represents the STATSGO soil layer attribute, salinity, compiled for two spatial components of the NHDPlus version 2 data suite (NHDPlusv2) for the conterminous United States; 1) individual reach catchments and 2) reach catchments accumulated upstream through the river network. The source data is found in the LAYER table from the "STATSGO soil characteristics for the conterminous United States" produced by the United States Geological Survey (Wolock, 1997). The ability of a water sample to conduct electricity is used to determine its salt content and is reported as milliohms per centimeter (mohms/cm). This dataset can be linked to the NHDPlus version 2 data suite by the unique identifier COMID....
This tabular data set represents annual average precipitation values (millimeters) described in Wolock and McCabe (2017), compiled for the NHDPlus version 2 data suite (NHDPlusV2) for the conterminous United States. Linkage of the precipitation data with NHDPlusV2 is achieved through the common unique identifier COMID. The precipitation values are estimated both for: 1) individual reach catchments and 2) reach catchments accumulated upstream through the river network. The reach catchment information characterizes data at the local scale, whereas the catchments accumulated through the river network characterize cumulative upstream conditions. The network-accumulated values are derived using two methods: 1) divergence...
This data set represents the Insecticide use on agricultural land in kilograms per square kilometer, 2009 value compiled for two spatial components of the NHDPlus version 2 data suite (NHDPlusv2) for the conterminous United States; 1) individual reach catchments and 2) reach catchments accumulated upstream through the river network (i.e., watersheds). This dataset can be linked to the NHDPlus version 2 data suite by the unique identifier COMID. The source data were produced by Baker, N.T., 2015. Units for the Insecticide use on agricultural land in kilograms per square kilometer, 2009 are kilogram per square kilometer. Reach catchment information characterizes data at the local scale. Reach catchments accumulated...
Types: Citation;
Tags: Arkansas-White_Red,
California,
Catchment,
Conterminous United States,
Great Lakes,
This tabular data set represents monthly average annual runoff (mm) from McCabe and Wolock's Runoff Model 1945-2015 compiled for two spatial components of the NHDPlus version 2 data suite (NHDPlusv2) for the conterminous United States; 1) individual reach catchments and 2) reach catchments accumulated upstream through the river network. This dataset can be linked to the NHDPlus version 2 data suite by the unique identifier COMID. The source data for average annual runoff (mm) from McCabe and Wolock's Runoff Model 1945-2015 was produced by McCabe and Wolock (USGS, 2017). Units are millimeters per year. Reach catchment information characterizes data at the local scale. Reach catchments accumulated upstream through...
This tabular data set represents the mean rate of nitrogen from fertilizer and manure applied on agricultural land in 1997 compiled for two spatial components of the NHDPlus version 2 data suite (NHDPlusv2) for the conterminous United States; 1) individual reach catchments and 2) reach catchments accumulated upstream through the river network. This dataset can be linked to the NHDPlus version 2 data suite by the unique identifier COMID. The source data for mean rate of nitrogen from fertilizer and manure applied on agricultural land in 1997 was produced by Ruddy and others, (USGS, 2006). Units are kilogram per square kilometer. Reach catchment information characterizes data at the local scale. Reach catchments accumulated...
This data release includes grids representing the depth and thickness of drinking-water withdrawal zones, polygons of hydrogeologic settings, an inventory of sources of well construction data, and summaries of data comparisons used to assess the depth of groundwater used for drinking-water supplies in the United States. Well construction data sources are documented in Table1_DataSources.xlsx. Data comparisons using the Mann-Whitney test to assess similarity between hydrogeologic settings were used to justify combining data where they were sparse (compare_neighbors_all_domestic.txt and compare_neighbors_all_public.txt). Water-supply-well depth varies geographically by water use and the type of well, which illustrates...
Categories: Data,
Data Release - Revised;
Types: Map Service,
OGC WFS Layer,
OGC WMS Layer,
OGC WMS Service;
Tags: Cycle 3,
Hydrology,
NAWQA,
USGS Science Data Catalog (SDC),
United States,
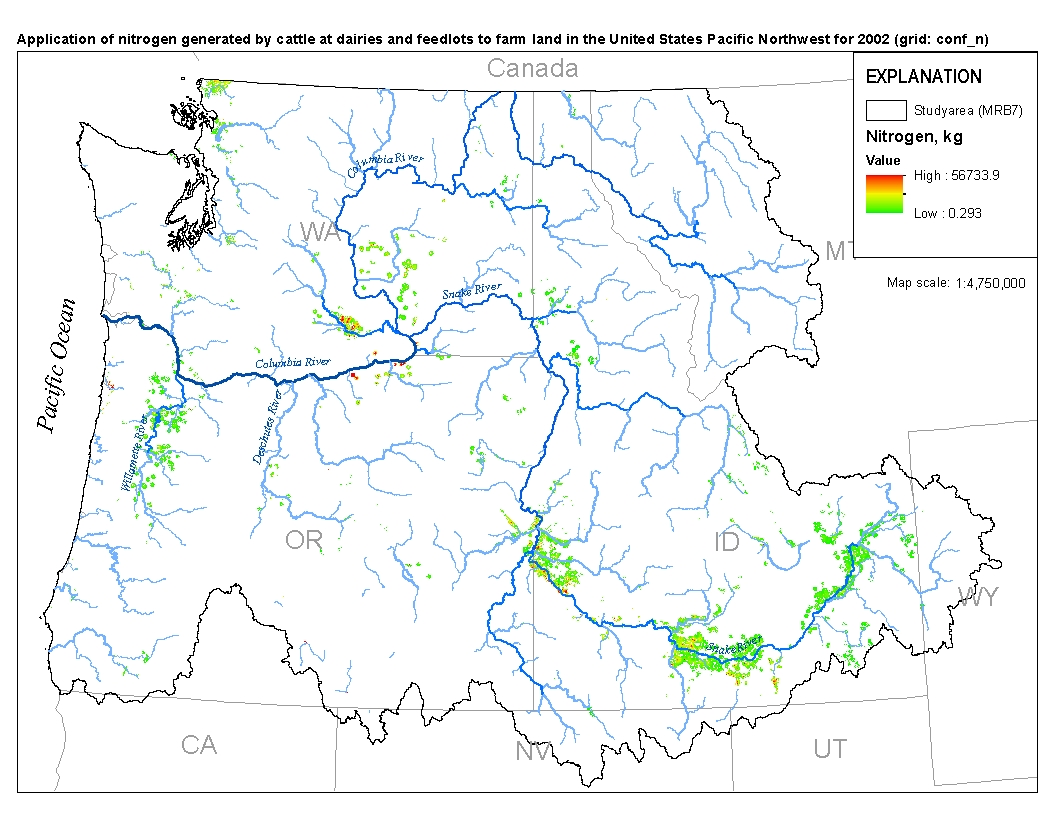
This spatial data set was created by the U.S. Geological Survey (USGS) to represent the amount of nitrogen generated at confined cattle operations that was applied to nearby farm land in the Pacific Northwest region of the United States (Hydro Region 17; Major River Basin 7 (MRB7)) during 2002.

These data were released prior to the October 1, 2016 effective date for the USGS’s policy dictating the review, approval, and release of scientific data as referenced in USGS Survey Manual Chapter 502.8 Fundamental Science Practices: Review and Approval of Scientific Data for Release. This spatial data set was created by the U.S. Geological Survey (USGS) to represent the amount of phosphorus generated at confined cattle operations that was applied to nearby farm land in the Pacific Northwest region of the United States (Hydro Region 17; Major River Basin 7 (MRB7)) during 2002.

These data were released prior to the October 1, 2016 effective date for the USGS’s policy dictating the review, approval, and release of scientific data as referenced in USGS Survey Manual Chapter 502.8 Fundamental Science Practices: Review and Approval of Scientific Data for Release. This spatial data set was created by the U.S. Geological Survey (USGS) to represent populations that did not have access to municipal sewer service in the Pacific Northwest region of the United States (Hydro Region 17; Major River Basin 7 (MRB7)) in 2002.

These data were released prior to the October 1, 2016 effective date for the USGS’s policy dictating the review, approval, and release of scientific data as referenced in USGS Survey Manual Chapter 502.8 Fundamental Science Practices: Review and Approval of Scientific Data for Release. This spatial data set was created by the U.S. Geological Survey (USGS) to represent the amount of nitrogen and phosphorus that was generated by livestock and applied to land in the Pacific Northwest region of the United States (Hydro Region 17; Major River Basin 7 (MRB7)) during 2002 within each incremental watershed delineated in the NHDPlus v2 dataset.
These data were released prior to the October 1, 2016 effective date for the USGS’s policy dictating the review, approval, and release of scientific data as referenced in USGS Survey Manual Chapter 502.8 Fundamental Science Practices: Review and Approval of Scientific Data for Release. This is a coverage of the boundaries and codes used for the U.S. Geological Survey's National Water-Quality Assessment (NAWQA) Program Study-Unit investigations in the conterminous United States, excluding the High Plains Regional Ground-Water Study. The data set represents the areas to be studied during the second cycle of the NAWQA Program, from 2001-2012 ("cycle 2").

These data were released prior to the October 1, 2016 effective date for the USGS’s policy dictating the review, approval, and release of scientific data as referenced in USGS Survey Manual Chapter 502.8 Fundamental Science Practices: Review and Approval of Scientific Data for Release. This spatial data set was created by the U.S. Geological Survey (USGS) to represent the amount of fertilizer phosphorus that was applied to farm land in the Pacific Northwest region of the United States (Hydro Region 17; Major River Basin 7 (MRB7)) during 2002.

These data were released prior to the October 1, 2016 effective date for the USGS’s policy dictating the review, approval, and release of scientific data as referenced in USGS Survey Manual Chapter 502.8 Fundamental Science Practices: Review and Approval of Scientific Data for Release. This data set represents the presence or absence of poorly sorted glacial till east of the Rocky Mountains in the conterminous United States. The data set was used as an input data layer for a national model to predict nitrate concentration in ground water used for drinking. Nolan and Hitt (2006) developed two national models to predict contamination of ground water by nonpoint sources of nitrate. The nonlinear approach to national-scale...

These data were released prior to the October 1, 2016 effective date for the USGS’s policy dictating the review, approval, and release of scientific data as referenced in USGS Survey Manual Chapter 502.8 Fundamental Science Practices: Review and Approval of Scientific Data for Release. This data set represents the presence or absence of sandstone and carbonate rock aquifers in the conterminous United States. The data set was used as an input data layer for a national model to predict nitrate concentration in ground water used for drinking. Nolan and Hitt (2006) developed two national models to predict contamination of ground water by nonpoint sources of nitrate. The nonlinear approach to national-scale Ground-WAter...

These data were released prior to the October 1, 2016 effective date for the USGS’s policy dictating the review, approval, and release of scientific data as referenced in USGS Survey Manual Chapter 502.8 Fundamental Science Practices: Review and Approval of Scientific Data for Release. This tabular data set represents the area of bedrock geology types in square meters compiled for every catchment of MRB_E2RF1 catchments for Major River Basins (MRBs, Crawford and others, 2006). The source data set is the "Geology of the Conterminous United States at 1:2,500,000 Scale--A Digital Representation of the 1974 P.B. King and H.M. Beikman Map" (Schuben and others, 1994). The MRB_E2RF1 catchments are based on a modified...
|

|
