Filters: Tags: Nye County (X)
1,237 results (66ms)|
Filters
Date Range
Extensions Types
Contacts
Categories Tag Types
|

These data were released prior to the October 1, 2016 effective date for the USGS’s policy dictating the review, approval, and release of scientific data as referenced in USGS Survey Manual Chapter 502.8 Fundamental Science Practices: Review and Approval of Scientific Data for Release. The false-color composite image of the Death Valley regional ground-water flow system (DVRFS), an approximately 100,000 square-kilometer region of southern Nevada and California, was derived from Landsat 5 Thematic Mapper (TM) data for 1996. The image is a composite of spectral bands 2, 4, and 7 in RGB (Red-Green-Blue) space. Individual bands were processed to display their full dynamic range. The image was further processed in hue-saturation...

These data were released prior to the October 1, 2016 effective date for the USGS’s policy dictating the review, approval, and release of scientific data as referenced in USGS Survey Manual Chapter 502.8 Fundamental Science Practices: Review and Approval of Scientific Data for Release. This digital data set defines the boundary of the ground-water flow model by D'Agnese and others (1997). This steady-state, 3-layer ground-water flow model was developed by the U.S. Geological Survey (USGS) for the U.S. Department of Energy (DOE) to support investigations at Yucca Mountain, Nevada (see "Larger Work Citation", Chapter A, pages 7-8, for details). The model area encompasses approximately 35,000 square-kilometers of...
This data release (version 2.0, December 2018) consists of two files, a Microsoft® Access database and Microsoft® Excel workbook, that contain water levels collected from 1941 to 2018 and other hydrologic information for 910 wells in and near areas of underground nuclear testing at the Nevada Test Site. Data and information in the database and workbook have been updated and are superseded by version 3.0 (January 2020) of the data release.
This data set consists of 59 wideband magnetotelluric (MT) stations collected by the U.S. Geological Survey in July and August of 2020 as part of a 1-year project funded by the Energy Resources Program of the U.S. Geological Survey to demonstrate full crustal control on geothermal systems in the Great Basin. Each station had 5 components, 3 orthogonal magnetic induction coils and 2 horizontal orthogonal electric dipoles. Data were collected for an average of 18 hours on a repeating schedule of alternating sampling rates of 256 samples/second for 7 hours and 50 minutes and 4096 samples/second for 10 minutes. The schedules were set such that each station was recording the same schedule to allow for remote reference...
Categories: Data;
Types: Downloadable,
Map Service,
OGC WFS Layer,
OGC WMS Layer,
Shapefile;
Tags: Energy Resources Program,
GMEGSC,
Gabbs,
Gabbs Valley,
Geology Minerals Energy and Geophysics Science Center,
This data set consists of 59 wideband magnetotelluric (MT) stations collected by the U.S. Geological Survey in July and August of 2020 as part of a 1-year project funded by the Energy Resources Program of the U.S. Geological Survey to demonstrate full crustal control on geothermal systems in the Great Basin. Each station had 5 components, 3 orthogonal magnetic induction coils and 2 horizontal orthogonal electric dipoles. Data were collected for an average of 18 hours on a repeating schedule of alternating sampling rates of 256 samples/second for 7 hours and 50 minutes and 4096 samples/second for 10 minutes. The schedules were set such that each station was recording the same schedule to allow for remote reference...
This data set consists of 59 wideband magnetotelluric (MT) stations collected by the U.S. Geological Survey in July and August of 2020 as part of a 1-year project funded by the Energy Resources Program of the U.S. Geological Survey to demonstrate full crustal control on geothermal systems in the Great Basin. Each station had 5 components, 3 orthogonal magnetic induction coils and 2 horizontal orthogonal electric dipoles. Data were collected for an average of 18 hours on a repeating schedule of alternating sampling rates of 256 samples/second for 7 hours and 50 minutes and 4096 samples/second for 10 minutes. The schedules were set such that each station was recording the same schedule to allow for remote reference...
This data set consists of 59 wideband magnetotelluric (MT) stations collected by the U.S. Geological Survey in July and August of 2020 as part of a 1-year project funded by the Energy Resources Program of the U.S. Geological Survey to demonstrate full crustal control on geothermal systems in the Great Basin. Each station had 5 components, 3 orthogonal magnetic induction coils and 2 horizontal orthogonal electric dipoles. Data were collected for an average of 18 hours on a repeating schedule of alternating sampling rates of 256 samples/second for 7 hours and 50 minutes and 4096 samples/second for 10 minutes. The schedules were set such that each station was recording the same schedule to allow for remote reference...
The 'Golden Arrow, Clifford and Ellendale Districts' file is part of the Grover Heinrichs mining collection. Grover was the Vice President of Heinrichs GEOEXploration, located in Tucson, Arizona. The collection contains over 1,400 folders including economic geology reports, maps, photos, correspondence, drill logs and other related materials. The focus of much of the information is on the western United States, particularly Arizona, but the collection also includes files on mining activity throughout the United States, foreign countries, and 82 mineral commodities.
The 'Athens Mining District, Warrior Gold Mine' file is part of the Grover Heinrichs mining collection. Grover was the Vice President of Heinrichs GEOEXploration, located in Tucson, Arizona. The collection contains over 1,400 folders including economic geology reports, maps, photos, correspondence, drill logs and other related materials. The focus of much of the information is on the western United States, particularly Arizona, but the collection also includes files on mining activity throughout the United States, foreign countries, and 82 mineral commodities.
The 'Siskon Corporation Properties' file is part of the Grover Heinrichs mining collection. Grover was the Vice President of Heinrichs GEOEXploration, located in Tucson, Arizona. The collection contains over 1,400 folders including economic geology reports, maps, photos, correspondence, drill logs and other related materials. The focus of much of the information is on the western United States, particularly Arizona, but the collection also includes files on mining activity throughout the United States, foreign countries, and 82 mineral commodities.
The 'Gold Dike District, Buzzard Peak Claims' file is part of the Grover Heinrichs mining collection. Grover was the Vice President of Heinrichs GEOEXploration, located in Tucson, Arizona. The collection contains over 1,400 folders including economic geology reports, maps, photos, correspondence, drill logs and other related materials. The focus of much of the information is on the western United States, particularly Arizona, but the collection also includes files on mining activity throughout the United States, foreign countries, and 82 mineral commodities.
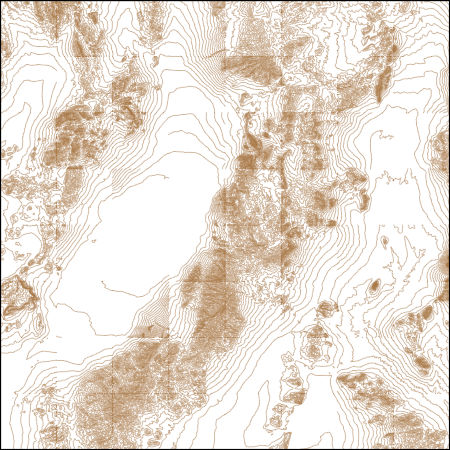
These vector contour lines are derived from the 3D Elevation Program using automated and semi-automated processes. They were created to support 1:24,000-scale CONUS and Hawaii, 1:25,000-scale Alaska, and 1:20,000-scale Puerto Rico / US Virgin Island topographic map products, but are also published in this GIS vector format. Contour intervals are assigned by 7.5-minute quadrangle, so this vector dataset is not visually seamless across quadrangle boundaries. The vector lines have elevation attributes (in feet above mean sea level on NAVD88), but this dataset does not carry line symbols or annotation.

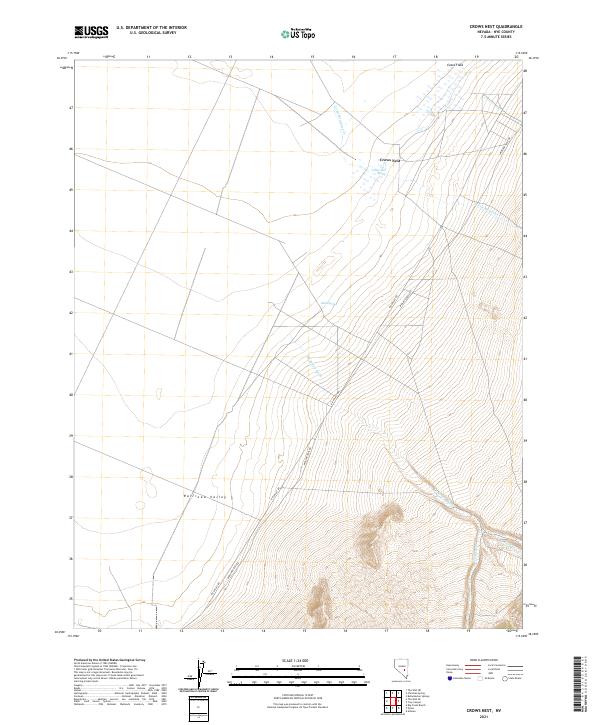
Layered geospatial PDF 7.5 Minute Quadrangle Map. Layers of geospatial data include orthoimagery, roads, grids, geographic names, elevation contours, hydrography, and other selected map features. This map is derived from GIS (geospatial information system) data. It represents a repackaging of GIS data in traditional map form, not creation of new information. The geospatial data in this map are from selected National Map data holdings and other government sources.
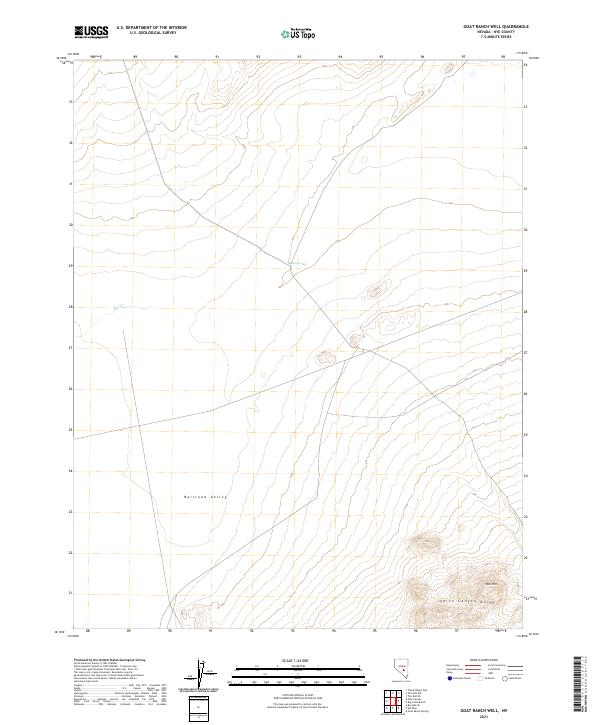
Layered geospatial PDF 7.5 Minute Quadrangle Map. Layers of geospatial data include orthoimagery, roads, grids, geographic names, elevation contours, hydrography, and other selected map features. This map is derived from GIS (geospatial information system) data. It represents a repackaging of GIS data in traditional map form, not creation of new information. The geospatial data in this map are from selected National Map data holdings and other government sources.
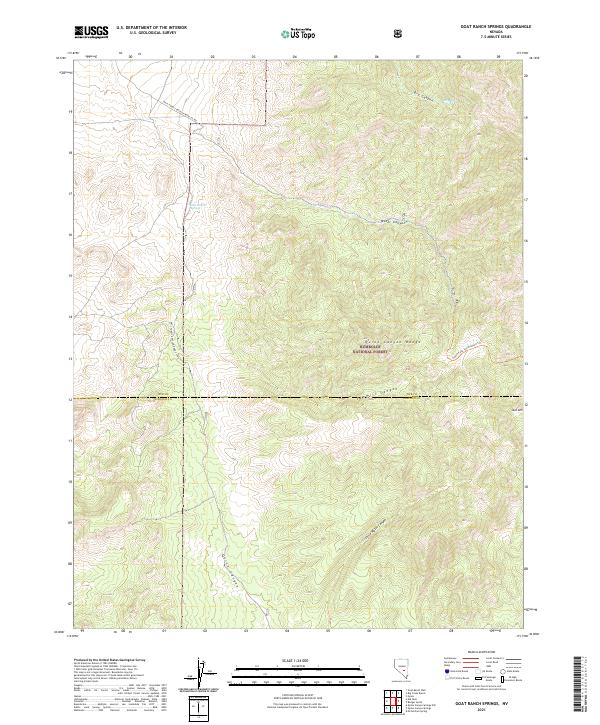
Layered geospatial PDF 7.5 Minute Quadrangle Map. Layers of geospatial data include orthoimagery, roads, grids, geographic names, elevation contours, hydrography, and other selected map features. This map is derived from GIS (geospatial information system) data. It represents a repackaging of GIS data in traditional map form, not creation of new information. The geospatial data in this map are from selected National Map data holdings and other government sources.
Layered geospatial PDF 7.5 Minute Quadrangle Map. Layers of geospatial data include orthoimagery, roads, grids, geographic names, elevation contours, hydrography, and other selected map features. This map is derived from GIS (geospatial information system) data. It represents a repackaging of GIS data in traditional map form, not creation of new information. The geospatial data in this map are from selected National Map data holdings and other government sources.
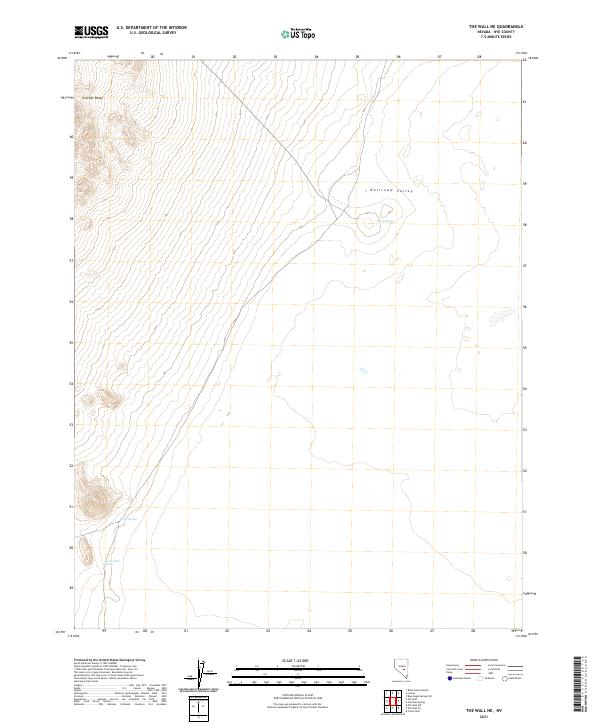
Layered geospatial PDF 7.5 Minute Quadrangle Map. Layers of geospatial data include orthoimagery, roads, grids, geographic names, elevation contours, hydrography, and other selected map features. This map is derived from GIS (geospatial information system) data. It represents a repackaging of GIS data in traditional map form, not creation of new information. The geospatial data in this map are from selected National Map data holdings and other government sources.
Layered geospatial PDF 7.5 Minute Quadrangle Map. Layers of geospatial data include orthoimagery, roads, grids, geographic names, elevation contours, hydrography, and other selected map features. This map is derived from GIS (geospatial information system) data. It represents a repackaging of GIS data in traditional map form, not creation of new information. The geospatial data in this map are from selected National Map data holdings and other government sources.
Layered geospatial PDF 7.5 Minute Quadrangle Map. Layers of geospatial data include orthoimagery, roads, grids, geographic names, elevation contours, hydrography, and other selected map features. This map is derived from GIS (geospatial information system) data. It represents a repackaging of GIS data in traditional map form, not creation of new information. The geospatial data in this map are from selected National Map data holdings and other government sources.
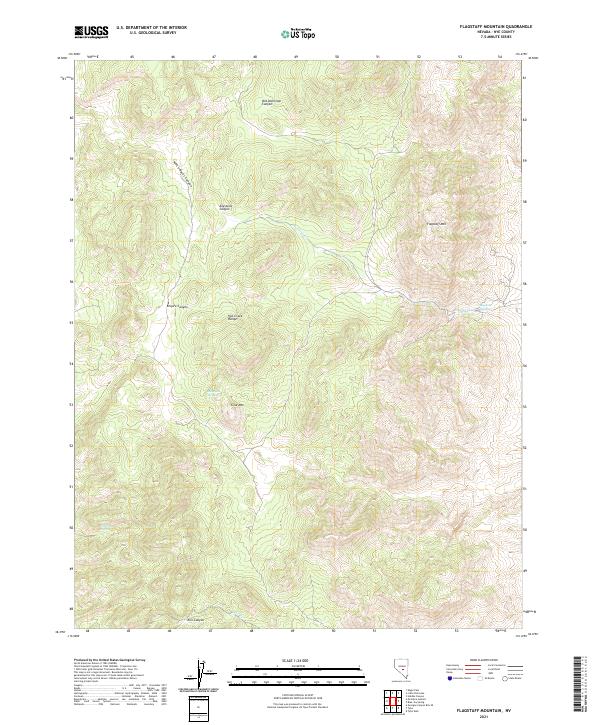
Layered geospatial PDF 7.5 Minute Quadrangle Map. Layers of geospatial data include orthoimagery, roads, grids, geographic names, elevation contours, hydrography, and other selected map features. This map is derived from GIS (geospatial information system) data. It represents a repackaging of GIS data in traditional map form, not creation of new information. The geospatial data in this map are from selected National Map data holdings and other government sources.
|

|
