Filters: Tags: PNW (X)
92 results (11ms)|
Filters
Date Range
Extensions (Less) Types (Less)
Contacts (Less)
Categories (Less) Tag Types
|
For his MS thesis, Brendan Rogers used the vegetation model MC1 to simulate vegetation dynamics, associated carbon and nitrogen cycle, water budget and wild fire impacts across the western 2/3 of the states of Oregon and Washington using climate input data from the the PRISM group (Chris Daly, OSU) at a 30arc second (800m) spatial grain. The model was run from 1895 to 2100 assuming that nitrogen demand from the plants was always met so that the nitrogen concentrations in various plant parts never dropped below their minimum reported values. A CO2 enhancement effect increased productivity and water use efficiency as the atmospheric CO2 concentration increased. Future climate change scenarios were generated through...
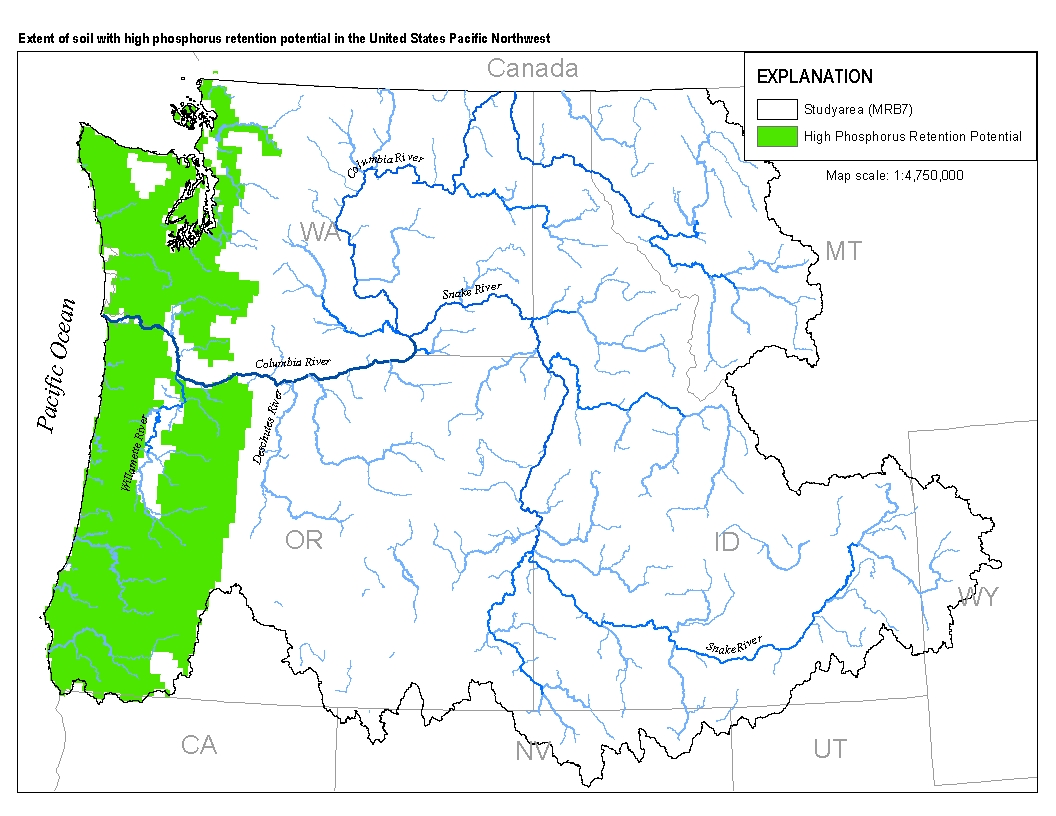
This spatial data set was created by the U.S. Geological Survey (USGS) to represent the extent of soils with high phosphorus retention potential in the Pacific Northwest region of the United States (Hydro Region 17; Major River Basin 7 (MRB7)).
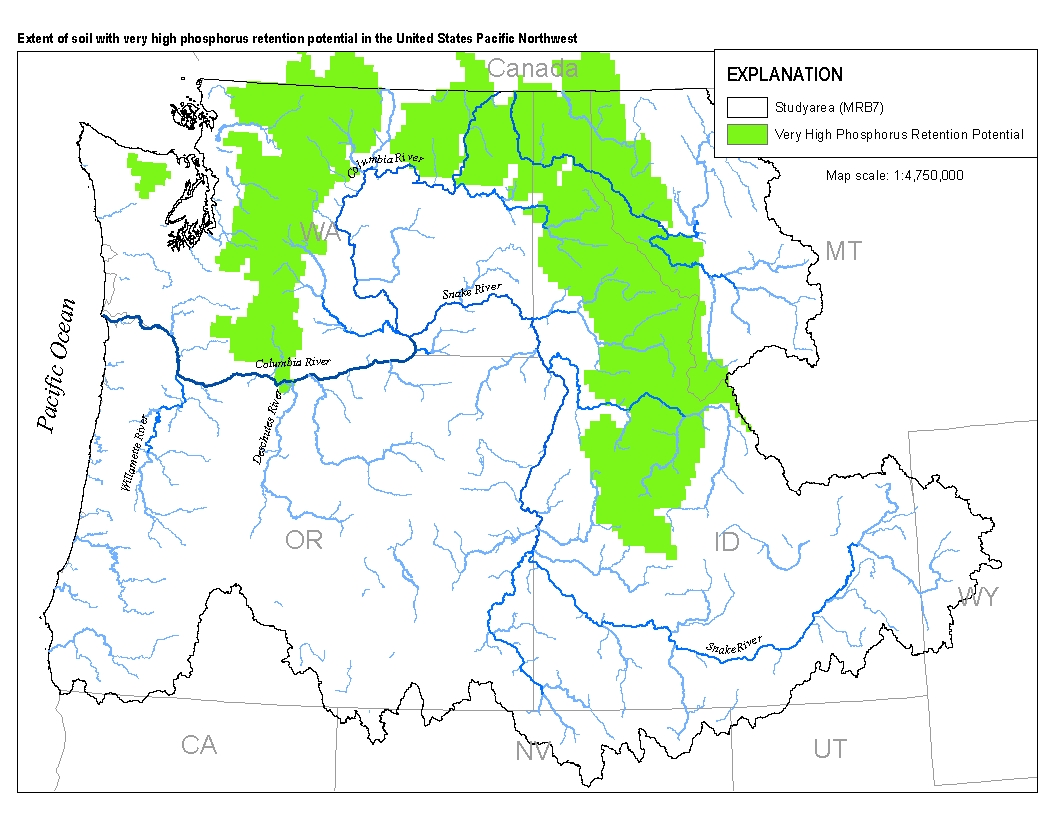
This spatial data set was created by the U.S. Geological Survey (USGS) to represent the extent of soils with very high levels of phosphorus retention potential in the Pacific Northwest region of the United States (Hydro Region 17; Major River Basin 7 (MRB7)).
For his MS thesis, Brendan Rogers used the vegetation model MC1 to simulate vegetation dynamics, associated carbon and nitrogen cycle, water budget and wild fire impacts across the western 2/3 of the states of Oregon and Washington using climate input data from the PRISM group (Chris Daly, OSU) at a 30arc second (800m) spatial grain. The model was run from 1895 to 2100 assuming that nitrogen demand from the plants was always met so that the nitrogen concentrations in various plant parts never dropped below their minimum reported values. A CO2 enhancement effect increased productivity and water use efficiency as the atmospheric CO2 concentration increased. Future climate change scenarios were generated through statistical...
The overarching goal of the project was to develop overlapping conceptual models of environmental and community health indicators in reference to climate forecasts. The sensitivity of species and habitats to climate were cross-walked with recently developed Coast Salish community health indicators (e.g. ceremonial use, knowledge exchange, and physiological well-being) in order to demonstrate how Indigenous Knowledge can be used in conjunction with established landscape-level conservation indicators (e.g. shellfish and water-quality) and employed to identify resource management priorities. While results are unique to study participants, no Indigenous community in the coastal Pacific Northwest is immune to the impending...

These data were released prior to the October 1, 2016 effective date for the USGS’s policy dictating the review, approval, and release of scientific data as referenced in USGS Survey Manual Chapter 502.8 Fundamental Science Practices: Review and Approval of Scientific Data for Release. This spatial data set was created by the U.S. Geological Survey (USGS) to represent the amount of wet deposition of reduced nitrogen in the Pacific Northwest region of the United States (Hydro Region 17; Major River Basin 7 (MRB7)) during 2002.

These data were released prior to the October 1, 2016 effective date for the USGS’s policy dictating the review, approval, and release of scientific data as referenced in USGS Survey Manual Chapter 502.8 Fundamental Science Practices: Review and Approval of Scientific Data for Release. This spatial data set was created by the U.S. Geological Survey (USGS) to represent the basal area of red alder trees within each incremental watershed delineated in the NHDPlus v2 dataset in the Pacific Northwest region of the United States (Hydro Region 17; Major River Basin 7 (MRB7)) in 2001.

These data were released prior to the October 1, 2016 effective date for the USGS’s policy dictating the review, approval, and release of scientific data as referenced in USGS Survey Manual Chapter 502.8 Fundamental Science Practices: Review and Approval of Scientific Data for Release. This spatial data set was created by the U.S. Geological Survey (USGS) to represent the amount of total nitrogen and total phosphorus discharged to surface waters in the Pacific Northwest region of the United States (Hydro Region 17; Major River Basin 7 (MRB7)) during 2002 from individual permitted wastewater facilities.

These data were released prior to the October 1, 2016 effective date for the USGS’s policy dictating the review, approval, and release of scientific data as referenced in USGS Survey Manual Chapter 502.8 Fundamental Science Practices: Review and Approval of Scientific Data for Release. This spatial data set was created by the U.S. Geological Survey (USGS) to represent areas that had access to municipal sewer service in the Pacific Northwest region of the United States (Hydro Region 17; Major River Basin 7 (MRB7)) in 2002.
Application of fertilizer phosphorus to nonfarm land in the United States Pacific Northwest for 2002
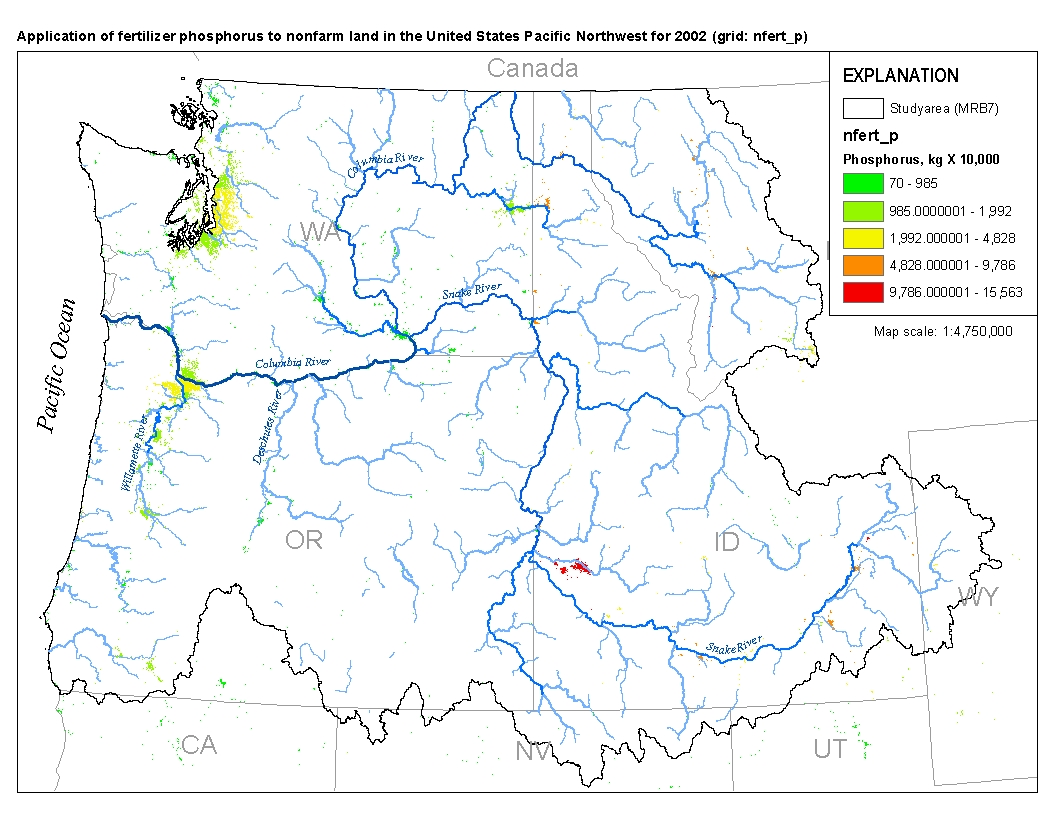
This spatial data set was created by the U.S. Geological Survey (USGS) to represent the amount of fertilizer phosphorus that was applied to nonfarm land in the Pacific Northwest region of the United States (Hydro Region 17; Major River Basin 7 (MRB7)) during 2002.
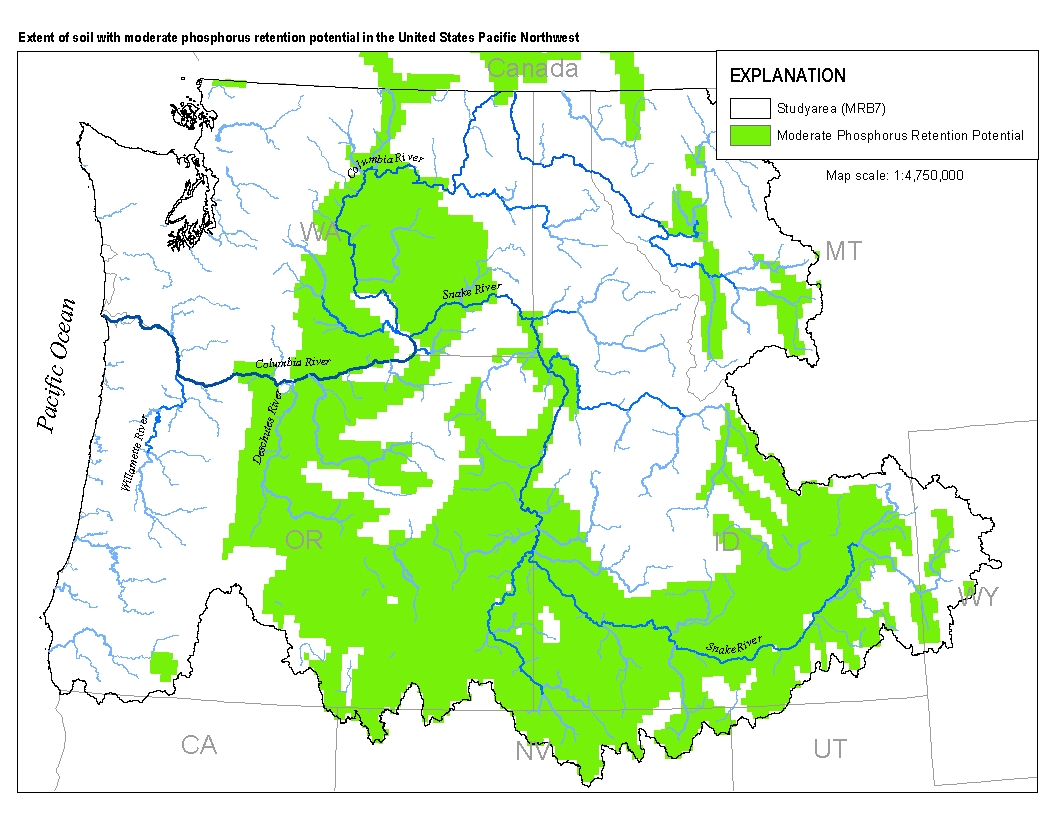
This spatial data set was created by the U.S. Geological Survey (USGS) to represent the extent of soils with moderate phosphorus retention potential in the Pacific Northwest region of the United States (Hydro Region 17; Major River Basin 7 (MRB7))
For his MS thesis, Brendan Rogers used the vegetation model MC1 to simulate vegetation dynamics, associated carbon and nitrogen cycle, water budget and wild fire impacts across the western 2/3 of the states of Oregon and Washington using climate input data from the PRISM group (Chris Daly, OSU) at a 30arc second (800m) spatial grain. The model was run from 1895 to 2100 assuming that nitrogen demand from the plants was always met so that the nitrogen concentrations in various plant parts never dropped below their minimum reported values. A CO2 enhancement effect increased productivity and water use efficiency as the atmospheric CO2 concentration increased. Future climate change scenarios were generated through statistical...
|

|
