Filters: Tags: Point sources (X)
10 results (43ms)|
Filters
Contacts
(Less)
|
This Science Base page is for transfer of files related to the work of the Water Reuse Program. This location is to be used for transfering large files and spatial data among project members. Data posted here is data created by project members and not otherwise published or accessible elsewhere. These pages are orginized as Spatial (point covergaes, polygon shapefiles etc) and Tabular Data (NWIS pulls, Climate pulls, etc) as such: Code-> Python R Spatial Data-> Surface Water Ground Water Tabular Data-> Climate NWIS flow data Ag Census
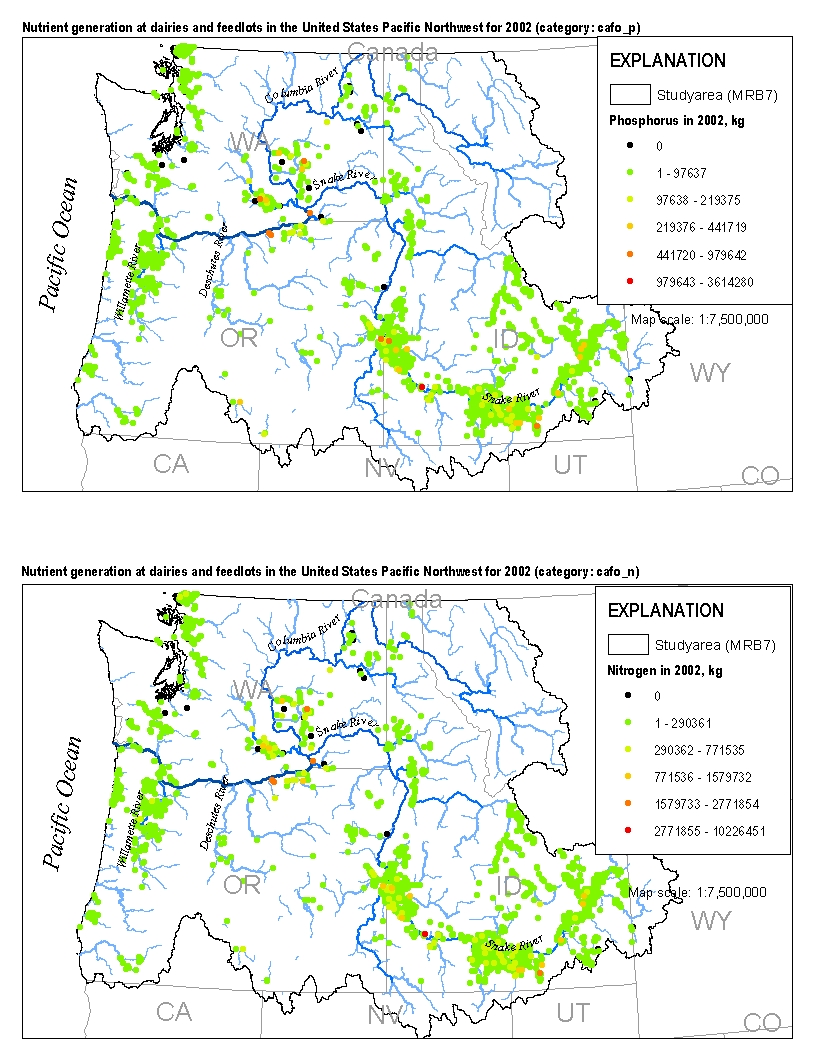
This spatial data set was created by the U.S. Geological Survey (USGS) to represent the amount of nitrogen and phosphorus generated by cattle at dairies and feedlots in the Pacific Northwest region of the United States (Hydro Region 17; Major River Basin 7 (MRB7)) during 2002.
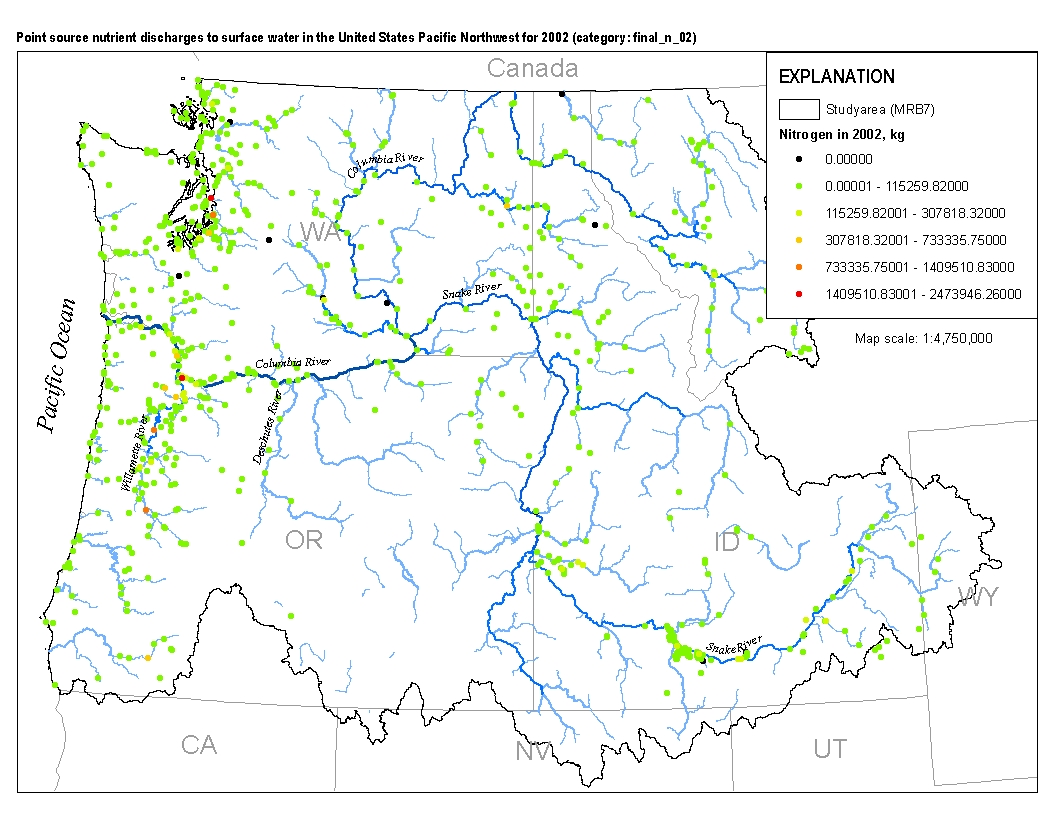
This spatial data set was created by the U.S. Geological Survey (USGS) to represent the amount of total nitrogen and total phosphorus discharged to surface waters in the Pacific Northwest region of the United States (Hydro Region 17; Major River Basin 7 (MRB7)) during 2002 from individual permitted wastewater facilities.
The Colorado River Basin, poor in water and rich in energy resources, is examined to see if water quality can be sustained for U.S. and Mexican users. Activities to mine, process, transport, and convert resources to energy and to reclaim the land all require water, although development is expected to continue in spite of uncertainties. Projections of water requirements for different energy sources are summarized for the 1990-2000 time period. Restrictions on water supply derive from both quantity limitations and such institutional barriers as water rights and contracts. Projections of the sources and occurrences of salinity levels and pollutants are detailed for each section of the Basin. Salinity is concluded to...
Categories: Publication;
Types: Citation,
Journal Citation;
Tags: Natural Resources Journal,
air pollution,
assessments,
basins,
brines,
This U.S. Geological Survey data release contains datasets that combine past data with future projections of nitrogen sources and nitrogen export to the Chesapeake Bay watershed for the years 1950-2050. To help understand the effect of human and environmental changes over this time period, data for nitrogen sources from wastewater, agricultural fertilizer and manure, and atmospheric deposition are combined with datasets of population and land use. These datasets were used in conjunction with a previously calibrated SPAtially Referenced Regression On Watershed attributes (SPARROW) modeling tool to estimate the mean annual loads of total nitrogen to the Chesapeake Bay and nontidal stream reaches in the watershed at...
This metadata record describes a series of data sets of natural and anthropogenic landscape features linked to NHDPlus Version 2.1’s (NHDPlusV2) approximately 2.7 million stream segments, their associated catchments, and their upstream watersheds within the conterminous United States. The data were linked to four spatial components of NHDPlusV2: individual reach catchments, riparian buffer zones around individual reaches, reach catchments accumulated downstream through the river network, and riparian buffer zones accumulated downstream through the river network. All data can be linked to NHDPlus using the COMID field in these tables and the ComID in the flowline shapefiles or FEATUREID in the catchment ones in the...

These data were released prior to the October 1, 2016 effective date for the USGS’s policy dictating the review, approval, and release of scientific data as referenced in USGS Survey Manual Chapter 502.8 Fundamental Science Practices: Review and Approval of Scientific Data for Release. This spatial data set was created by the U.S. Geological Survey (USGS) to represent the amount of nitrogen and phosphorus generated by cattle at dairies and feedlots in the Pacific Northwest region of the United States (Hydro Region 17; Major River Basin 7 (MRB7)) during 2002 within each incremental watershed delineated in the NHDPlus v2 dataset.

These data were released prior to the October 1, 2016 effective date for the USGS’s policy dictating the review, approval, and release of scientific data as referenced in USGS Survey Manual Chapter 502.8 Fundamental Science Practices: Review and Approval of Scientific Data for Release. This spatial data set was created by the U.S. Geological Survey (USGS) to represent the amount of total nitrogen and total phosphorus discharged to surface waters in the Pacific Northwest region of the United States (Hydro Region 17; Major River Basin 7 (MRB7)) during 2002 from all permitted wastewater facilities located within each incremental watershed delineated in the NHDPlus v2 dataset.

These data were released prior to the October 1, 2016 effective date for the USGS’s policy dictating the review, approval, and release of scientific data as referenced in USGS Survey Manual Chapter 502.8 Fundamental Science Practices: Review and Approval of Scientific Data for Release. This spatial data set was created by the U.S. Geological Survey (USGS) to represent the amount of nitrogen and phosphorus generated by cattle at dairies and feedlots in the Pacific Northwest region of the United States (Hydro Region 17; Major River Basin 7 (MRB7)) during 2002.

These data were released prior to the October 1, 2016 effective date for the USGS’s policy dictating the review, approval, and release of scientific data as referenced in USGS Survey Manual Chapter 502.8 Fundamental Science Practices: Review and Approval of Scientific Data for Release. This spatial data set was created by the U.S. Geological Survey (USGS) to represent the amount of total nitrogen and total phosphorus discharged to surface waters in the Pacific Northwest region of the United States (Hydro Region 17; Major River Basin 7 (MRB7)) during 2002 from individual permitted wastewater facilities.
|

|
