Filters: Tags: Posey County (X)
86 results (169ms)|
Filters
Date Range
Extensions (Less) Types (Less)
Contacts (Less)
Categories (Less) Tag Types Tag Schemes
|
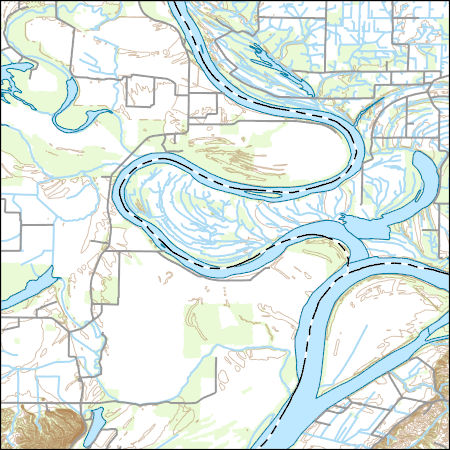
Natural river channels continually evolve and change shape over time. As a result, channel evolution or migration can cause problems for bridge structures that are fixed in the flood plain. A once-stable bridge structure that was uninfluenced by a river’s shape could be encroached upon by a migrating river channel. The potential effect of the actively meandering Wabash River on the Interstate 64 (I–64) Bridge at the border with Indiana near Grayville, Illinois, was studied using a river migration model called RVR Meander (RVR Meander, 2011). RVR Meander is a toolbox that can be used to model river channel meander migration with physically based bank erosion methods. This study assesses the Wabash River meandering...
Categories: Data;
Types: Citation;
Tags: Geomorphology,
Gibson County,
Grayville,
Hydrogeology,
Illinois,
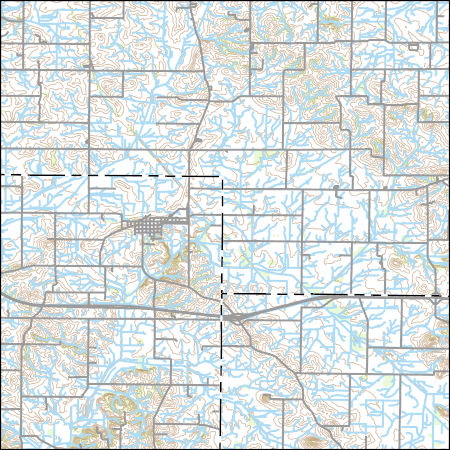
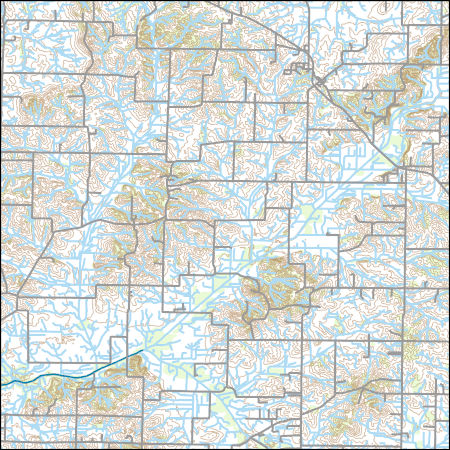
These vector contour lines are derived from the 3D Elevation Program using automated and semi-automated processes. They were created to support 1:24,000-scale CONUS and Hawaii, 1:25,000-scale Alaska, and 1:20,000-scale Puerto Rico / US Virgin Island topographic map products, but are also published in this GIS vector format. Contour intervals are assigned by 7.5-minute quadrangle, so this vector dataset is not visually seamless across quadrangle boundaries. The vector lines have elevation attributes (in feet above mean sea level on NAVD88), but this dataset does not carry line symbols or annotation.
A two-dimensional model and digital flood-inundation maps were developed for a 30-mile reach of the Wabash River near the Interstate 64 (I-64) Bridge near Grayville, Illinois. The flood-inundation maps, which can be accessed through the U.S. Geological Survey (USGS) Flood Inundation Mapping Science web site at http://water.usgs.gov/osw/flood_inundation/, depict estimates of the areal extent and depth of flooding corresponding to selected water levels (stages) at the USGS streamgage on the Wabash River at Mount Carmel, Ill (USGS station number 03377500). Near-real-time stages at this streamgage may be obtained on the internet from the USGS National Water Information System at http://waterdata.usgs.gov/ or the National...
Categories: Data;
Types: Citation;
Tags: Gibson County,
Grayville,
Illinois,
Indiana,
Interstate 64 (I-64),
Layers of geospatial data include contours, boundaries, land cover, hydrography, roads, transportation, geographic names, structures, and other selected map features.
Layers of geospatial data include contours, boundaries, land cover, hydrography, roads, transportation, geographic names, structures, and other selected map features.
Types: Citation;
Tags: 7.5 x 7.5 minute,
7_5_Min,
Combined Vector,
Combined Vector,
Combined Vector,
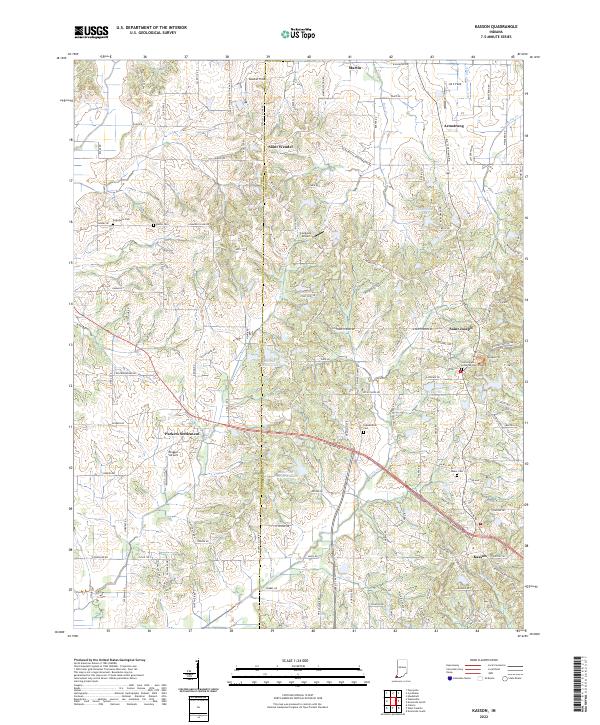
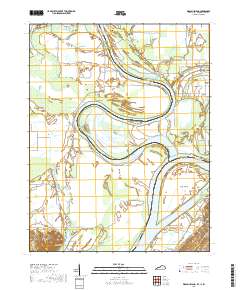
Layered geospatial PDF 7.5 Minute Quadrangle Map. Layers of geospatial data include orthoimagery, roads, grids, geographic names, elevation contours, hydrography, and other selected map features. This map is derived from GIS (geospatial information system) data. It represents a repackaging of GIS data in traditional map form, not creation of new information. The geospatial data in this map are from selected National Map data holdings and other government sources.
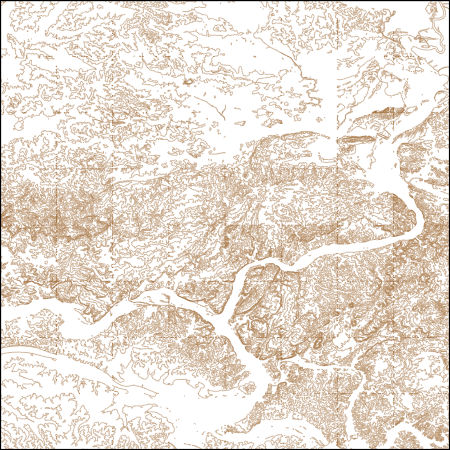
These vector contour lines are derived from the 3D Elevation Program using automated and semi-automated processes. They were created to support 1:24,000-scale CONUS and Hawaii, 1:25,000-scale Alaska, and 1:20,000-scale Puerto Rico / US Virgin Island topographic map products, but are also published in this GIS vector format. Contour intervals are assigned by 7.5-minute quadrangle, so this vector dataset is not visually seamless across quadrangle boundaries. The vector lines have elevation attributes (in feet above mean sea level on NAVD88), but this dataset does not carry line symbols or annotation.
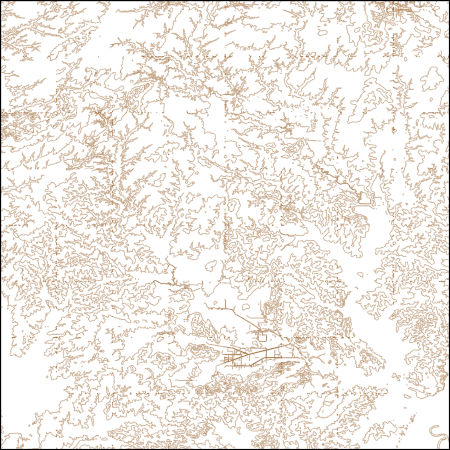
These vector contour lines are derived from the 3D Elevation Program using automated and semi-automated processes. They were created to support 1:24,000-scale CONUS and Hawaii, 1:25,000-scale Alaska, and 1:20,000-scale Puerto Rico / US Virgin Island topographic map products, but are also published in this GIS vector format. Contour intervals are assigned by 7.5-minute quadrangle, so this vector dataset is not visually seamless across quadrangle boundaries. The vector lines have elevation attributes (in feet above mean sea level on NAVD88), but this dataset does not carry line symbols or annotation.
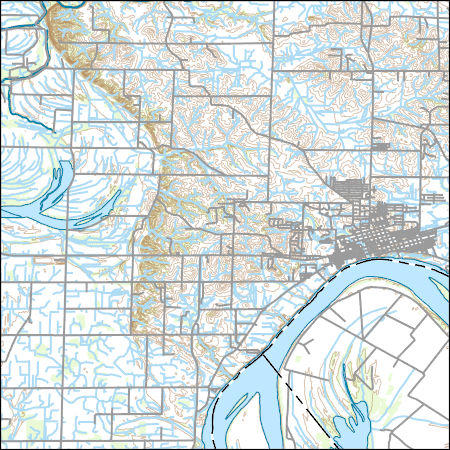
Layers of geospatial data include contours, boundaries, land cover, hydrography, roads, transportation, geographic names, structures, and other selected map features.
Types: Citation;
Tags: 7.5 x 7.5 minute,
7_5_Min,
Combined Vector,
Combined Vector,
Combined Vector,
A two-dimensional model and digital flood-inundation maps were developed for a 30-mile reach of the Wabash River near the Interstate 64 (I-64) Bridge near Grayville, Illinois. The flood-inundation maps, which can be accessed through the U.S. Geological Survey (USGS) Flood Inundation Mapping Science web site at http://water.usgs.gov/osw/flood_inundation/, depict estimates of the areal extent and depth of flooding corresponding to selected water levels (stages) at the USGS streamgage on the Wabash River at Mount Carmel, Ill (USGS station number 03377500). Near-real-time stages at this streamgage may be obtained on the internet from the USGS National Water Information System at http://waterdata.usgs.gov/ or the National...
Categories: Data;
Types: Citation;
Tags: Gibson County,
Grayville,
Illinois,
Indiana,
Interstate 64 (I-64),
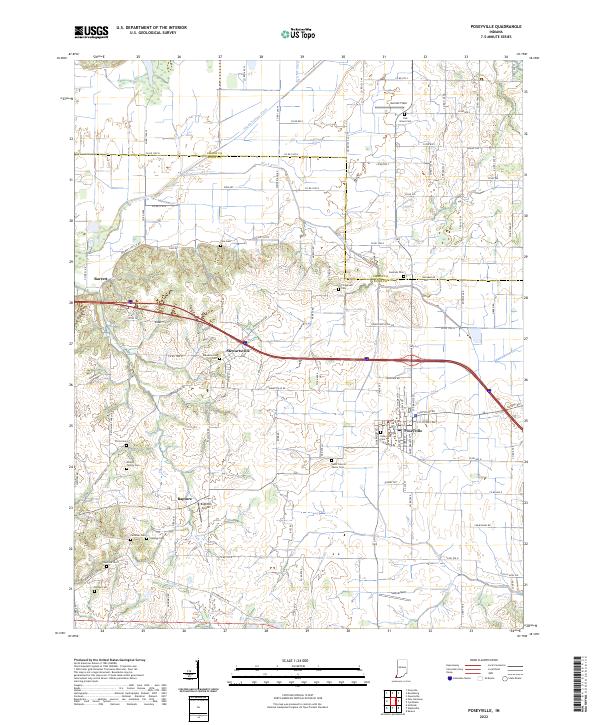
Layered geospatial PDF 7.5 Minute Quadrangle Map. Layers of geospatial data include orthoimagery, roads, grids, geographic names, elevation contours, hydrography, and other selected map features. This map is derived from GIS (geospatial information system) data. It represents a repackaging of GIS data in traditional map form, not creation of new information. The geospatial data in this map are from selected National Map data holdings and other government sources.
Layered geospatial PDF 7.5 Minute Quadrangle Map. Layers of geospatial data include orthoimagery, roads, grids, geographic names, elevation contours, hydrography, and other selected map features. This map is derived from GIS (geospatial information system) data. It represents a repackaging of GIS data in traditional map form, not creation of new information. The geospatial data in this map are from selected National Map data holdings and other government sources.
Layered geospatial PDF 7.5 Minute Quadrangle Map. Layers of geospatial data include orthoimagery, roads, grids, geographic names, elevation contours, hydrography, and other selected map features. This map is derived from GIS (geospatial information system) data. It represents a repackaging of GIS data in traditional map form, not creation of new information. The geospatial data in this map are from selected National Map data holdings and other government sources.
Layers of geospatial data include contours, boundaries, land cover, hydrography, roads, transportation, geographic names, structures, and other selected map features.
Types: Citation;
Tags: 7.5 x 7.5 minute,
7_5_Min,
Combined Vector,
Combined Vector,
Combined Vector,
Layers of geospatial data include contours, boundaries, land cover, hydrography, roads, transportation, geographic names, structures, and other selected map features.
Types: Citation;
Tags: 7.5 x 7.5 minute,
7_5_Min,
Combined Vector,
Combined Vector,
Combined Vector,

Layers of geospatial data include contours, boundaries, land cover, hydrography, roads, transportation, geographic names, structures, and other selected map features.
Layers of geospatial data include contours, boundaries, land cover, hydrography, roads, transportation, geographic names, structures, and other selected map features.

Layers of geospatial data include contours, boundaries, land cover, hydrography, roads, transportation, geographic names, structures, and other selected map features.
Types: Citation;
Tags: 7.5 x 7.5 minute,
7_5_Min,
Combined Vector,
Combined Vector,
Combined Vector,
An investigation was completed by the U.S. Geological Survey in cooperation with the Indiana Office of Community and Rural Affairs that found 1,132 transportation and utility assets in Indiana are vulnerable to fluvial erosion hazards due to close proximity to actively migrating streams. Locations of transportation assets (bridges, roadways, and railroad lines) and selected utility assets (high-capacity overhead power-transmission lines, underground pipelines, water treatment facilities, and in-channel dams) were determined using aerial imagery hosted by the Google Earth platform. Identified assets were aggregated by stream reach, county, and class. The contents of this data release include (1) a comma-delimited...
Categories: Data;
Types: Citation,
Map Service,
OGC WFS Layer,
OGC WMS Layer,
OGC WMS Service;
Tags: Adams County,
Allen County,
Bartholomew County,
Benton County,
Blackford County,
Layered geospatial PDF 7.5 Minute Quadrangle Map. Layers of geospatial data include orthoimagery, roads, grids, geographic names, elevation contours, hydrography, and other selected map features. This map is derived from GIS (geospatial information system) data. It represents a repackaging of GIS data in traditional map form, not creation of new information. The geospatial data in this map are from selected National Map data holdings and other government sources.
|

|
