Filters: Tags: South Dakota (X) > partyWithName: U.S. Geological Survey (X) > Types: Citation (X)
166 results (37ms)|
Filters
Date Range
Extensions Types
Contacts
Categories Tag Types
|
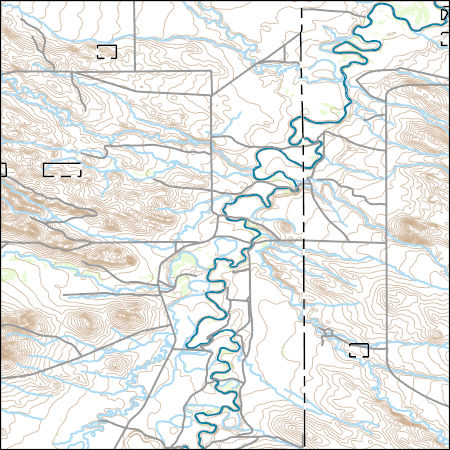
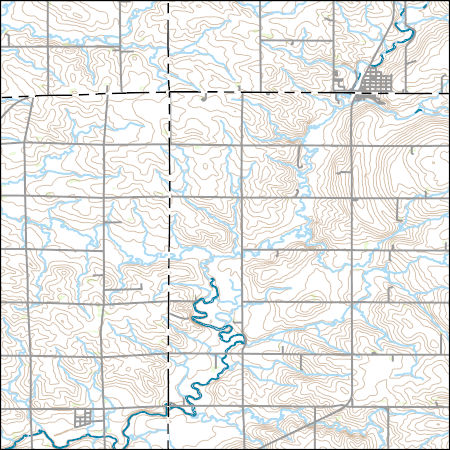
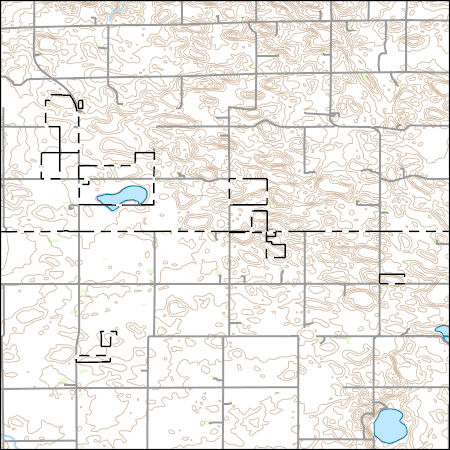
Layers of geospatial data include contours, boundaries, land cover, hydrography, roads, transportation, geographic names, structures, and other selected map features.
Types: Citation;
Tags: 7.5 x 7.5 minute,
7.5 x 7.5 minute,
Carter County,
Combined Vector,
Combined Vector,
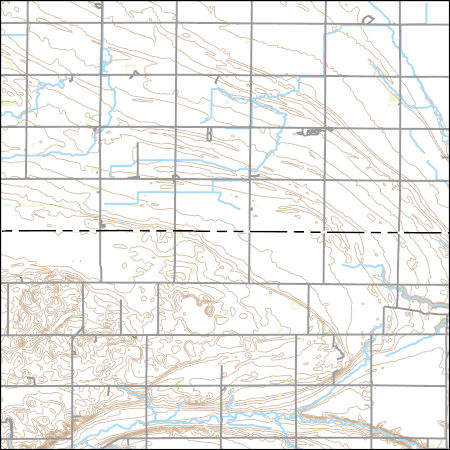
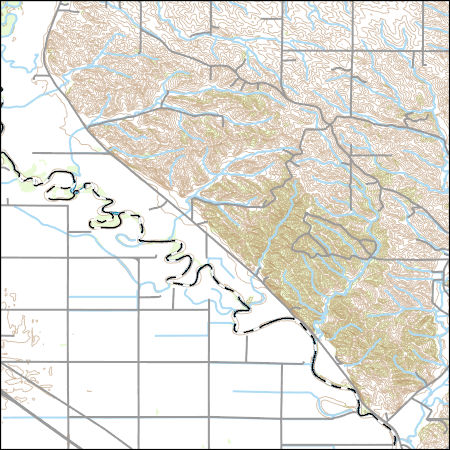
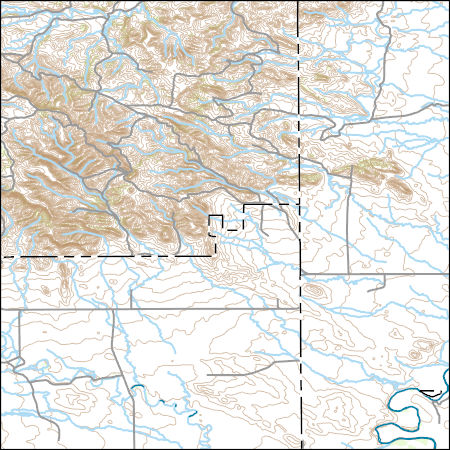
Layers of geospatial data include contours, boundaries, land cover, hydrography, roads, transportation, geographic names, structures, and other selected map features.
Types: Citation;
Tags: 7.5 x 7.5 minute,
7.5 x 7.5 minute,
Carter County,
Combined Vector,
Combined Vector,
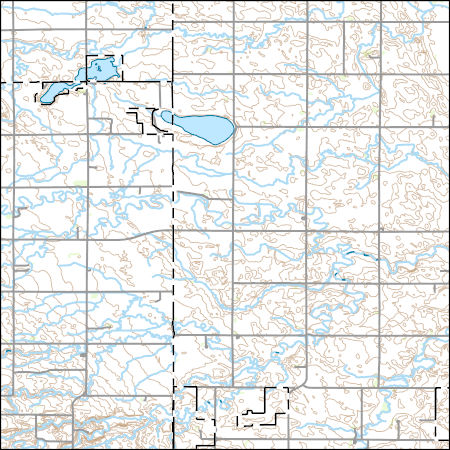
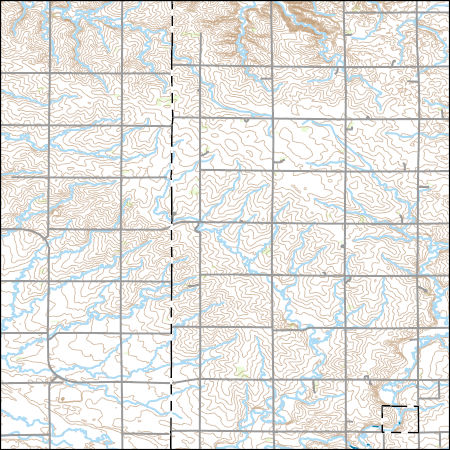
Layers of geospatial data include contours, boundaries, land cover, hydrography, roads, transportation, geographic names, structures, and other selected map features.
Types: Citation;
Tags: 7.5 x 7.5 minute,
7.5 x 7.5 minute,
Brown County,
Combined Vector,
Combined Vector,
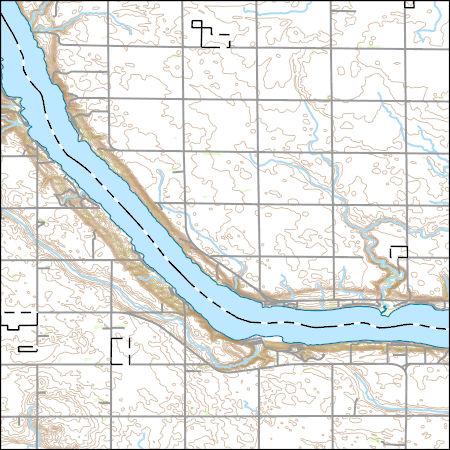
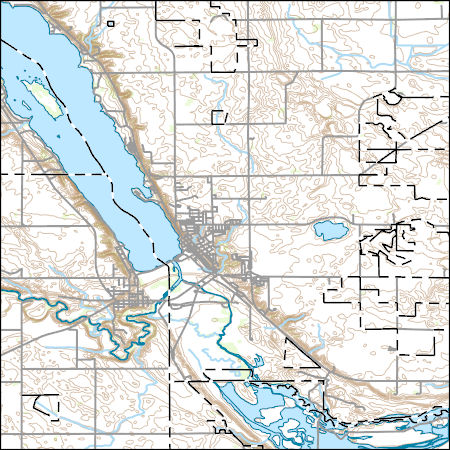
Layers of geospatial data include contours, boundaries, land cover, hydrography, roads, transportation, geographic names, structures, and other selected map features.
Types: Citation;
Tags: 7.5 x 7.5 minute,
7.5 x 7.5 minute,
Combined Vector,
Combined Vector,
Combined Vector,
Layers of geospatial data include contours, boundaries, land cover, hydrography, roads, transportation, geographic names, structures, and other selected map features.
Types: Citation;
Tags: 7.5 x 7.5 minute,
7.5 x 7.5 minute,
Carter County,
Combined Vector,
Combined Vector,
The dataset contains estimates for total phosphorus flux from wastewater treatment plants that discharge to surface water within the Red River of the North Basin in the United States and subbasins. Shapefiles defining the subbasins are available as part of the same data release in which these data are published. Estimates of wastewater treatment plant total phosphorus flux (or load) were calculated by Tammy Ivanhnenko for the years 1978, 1980, 1982, 1984, 1986, 1988, 1990, 1992, 1996, 2000, 2004, 2008, and 2012. Flux estimates were based on the average discharge from the wastewater treatment plants and treatment level, both reported as part of the U.S. Environmental Protection Agency's Clean Watershed Needs Survey,...
Layers of geospatial data include contours, boundaries, land cover, hydrography, roads, transportation, geographic names, structures, and other selected map features.
Types: Citation;
Tags: 7.5 x 7.5 minute,
7.5 x 7.5 minute,
Combined Vector,
Combined Vector,
Combined Vector,
Accurate and consistent estimates of shrubland ecosystem components are crucial to a better understanding of ecosystems condition in arid and semiarid lands. We developed an innovative approach by integrating multiple information to quantify shrubland components as continuous field products within the National Land Cover Database (NLCD). The approach consists of five major parts: field sample collection, high-resolution mapping of shrubland components using WorldView-3 imagery and regression tree models, Landsat 8 radiometric balancing and phenological mosaicking, coarse resolution estimate of shrubland components across a large geographic extent using Landsat 8 phenological mosaics and regression tree models, and...
Accurate and consistent estimates of shrubland ecosystem components are crucial to a better understanding of ecosystems condition in arid and semiarid lands. We developed an innovative approach by integrating multiple information to quantify shrubland components as continuous field products within the National Land Cover Database (NLCD). The approach consists of five major parts: field sample collection, high-resolution mapping of shrubland components using WorldView-3 imagery and regression tree models, Landsat 8 radiometric balancing and phenological mosaicking, coarse resolution estimate of shrubland components across a large geographic extent using Landsat 8 phenological mosaics and regression tree models, and...
Layers of geospatial data include contours, boundaries, land cover, hydrography, roads, transportation, geographic names, structures, and other selected map features.
Types: Citation;
Tags: 7.5 x 7.5 minute,
7.5 x 7.5 minute,
Combined Vector,
Combined Vector,
Combined Vector,
Layers of geospatial data include contours, boundaries, land cover, hydrography, roads, transportation, geographic names, structures, and other selected map features.
Types: Citation;
Tags: 7.5 x 7.5 minute,
7.5 x 7.5 minute,
Big Stone County,
Combined Vector,
Combined Vector,
Layers of geospatial data include contours, boundaries, land cover, hydrography, roads, transportation, geographic names, structures, and other selected map features.
Types: Citation;
Tags: 7.5 x 7.5 minute,
7.5 x 7.5 minute,
Combined Vector,
Combined Vector,
Combined Vector,
Layers of geospatial data include contours, boundaries, land cover, hydrography, roads, transportation, geographic names, structures, and other selected map features.
Types: Citation;
Tags: 7.5 x 7.5 minute,
7.5 x 7.5 minute,
Combined Vector,
Combined Vector,
Combined Vector,
Layers of geospatial data include contours, boundaries, land cover, hydrography, roads, transportation, geographic names, structures, and other selected map features.
Types: Citation;
Tags: 7.5 x 7.5 minute,
7.5 x 7.5 minute,
Brookings County,
Combined Vector,
Combined Vector,
Layers of geospatial data include contours, boundaries, land cover, hydrography, roads, transportation, geographic names, structures, and other selected map features.
Types: Citation;
Tags: 7.5 x 7.5 minute,
7.5 x 7.5 minute,
Big Stone County,
Combined Vector,
Combined Vector,
The delineation of priority areas in western North America for managing Greater Sage-Grouse (Centrocercus urophasianus) represents a broad-scale experiment in conservation biology. The strategy of limiting spatial disturbance and focusing conservation actions within delineated areas may benefit the greatest proportion of Greater Sage-Grouse. However, land use under normal restrictions outside priority areas potentially limits dispersal and gene flow, which can isolate priority areas and lead to spatially disjunct populations. We used graph theory, representing priority areas as spatially distributed nodes interconnected by movement corridors, to understand the capacity of priority areas to function as connected...
Layers of geospatial data include contours, boundaries, land cover, hydrography, roads, transportation, geographic names, structures, and other selected map features.
Types: Citation;
Tags: 7.5 x 7.5 minute,
7.5 x 7.5 minute,
Combined Vector,
Combined Vector,
Combined Vector,
Layers of geospatial data include contours, boundaries, land cover, hydrography, roads, transportation, geographic names, structures, and other selected map features.
Types: Citation;
Tags: 7.5 x 7.5 minute,
7.5 x 7.5 minute,
Carter County,
Combined Vector,
Combined Vector,

Layers of geospatial data include contours, boundaries, land cover, hydrography, roads, transportation, geographic names, structures, and other selected map features.
Types: Citation;
Tags: 7.5 x 7.5 minute,
7.5 x 7.5 minute,
Carter County,
Combined Vector,
Combined Vector,

Layers of geospatial data include contours, boundaries, land cover, hydrography, roads, transportation, geographic names, structures, and other selected map features.
Types: Citation;
Tags: 7.5 x 7.5 minute,
7.5 x 7.5 minute,
Carter County,
Combined Vector,
Combined Vector,
|

|
