Filters: Tags: Water (X)
891 results (112ms)|
Filters
Date Range
Extensions Types
Contacts
Categories
Tag Types
|
Climate and land-use change are major components of global environmental change with feedbacks between these components. The consequences of these interactions show that land use may exacerbate or alleviate climate change effects. Based on these findings it is important to use land-use scenarios that are consistent with the specific assumptions underlying climate-change scenarios. The Integrated Climate and Land-Use Scenarios (ICLUS) project developed land-use outputs that are based on a downscaled version of the Intergovernmental Panel on Climate Change (IPCC) Special Report on Emissions Scenarios (SRES) social, economic, and demographic storylines. ICLUS outputs are derived from a pair of models. A demographic...
Categories: Data;
Types: ArcGIS REST Map Service,
ArcGIS Service Definition,
Downloadable,
Map Service;
Tags: biota,
climate,
climatology,
ecosystem,
impervious surface,
Abstract (from http://onlinelibrary.wiley.com/doi/10.1002/hyp.10964/abstract): While the effects of land use change in urban areas have been widely examined, the combined effects of climate and land use change on the quality of urban and urbanizing streams have received much less attention. We describe a modelling framework that is applicable to the evaluation of potential changes in urban water quality and associated hydrologic changes in response to ongoing climate and landscape alteration. The grid-based spatially distributed model, Distributed Hydrology Soil Vegetation Model-Water Quality (DHSVM-WQ), is an outgrowth of DHSVM that incorporates modules for assessing hydrology and water quality in urbanized watersheds...
Categories: Publication;
Types: Citation;
Tags: Data Visualization & Tools,
Northwest CASC,
Rivers, Streams and Lakes,
Science Tools For Managers,
Streams,
Observed water temperatures from 1980-2019 were compiled for 2,332 lakes in the US. These data were used as training, test, and error-estimation data for process-guided deep learning models and the evaluation of process-based models. The data are formatted as a single csv (comma separated values) file with attributes corresponding to the unique combination of lake identifier, time, and depth. Data came from a variety of sources, including the Water Quality Portal, the North Temperate Lakes Long-Term Ecological Research Project, and digitized temperature records from the MN Department of Natural Resources. This dataset is part of a larger data release of lake temperature model inputs and outputs for these same lakes...
Daily lake surface temperatures estimates for 185,549 lakes across the contiguous United States from 1980 to 2020 generated using an entity-aware long short-term memory deep learning model. In-situ measurements used for model training and evaluation are from 12,227 lakes and are included as well as daily meteorological conditions and lake properties. Median per-lake estimated error found through cross validation on lakes with in-situ surface temperature observations was 1.24 °C. The generated dataset will be beneficial for a wide range of applications including estimations of thermal habitats and the impacts of climate change on inland lakes.
Using predicted lake temperatures from uncalibrated, process-based models (PB0) and process-guided deep learning models (PGDL), this dataset summarized a collection of thermal metrics to characterize lake temperature impacts on fish habitat for 881 lakes. Included in the metrics are daily thermal optical habitat areas and a set of over 172 annual thermal metrics.
This data release contains information to support water quality modeling in the Delaware River Basin (DRB). These data support both process-based and machine learning approaches to water quality modeling, including the prediction of stream temperature. This section contains observations related to the amount and quality of water in the Delaware River Basin. Data from a subset of reservoirs in the basin include observed daily depth-resolved water temperature, water levels, diversions, and releases. Data from streams in the basin include daily flow and temperature observations. Observations were compiled from a variety of sources, including the National Water Inventory System, Water Quality Portal, EcoSHEDS stream...
This dataset contains stream-stage data for Santa Cruz River at Tumacácori Downstream Site (SC11). The pressure transducer was mounted to a metal post secured in the stream near the left bank. The data were recorded using non-vented Solinst Levelogger for the period of June 16, 2016 to June 24, 2016. The data were logged continuously at a 15-minute interval and manually downloaded. Data were then corrected with the atmospheric pressure collected from a Solinst Barologger located at SC14. The data was processed and analyzed for erroneous data.
Categories: Data;
Types: Citation;
Tags: DNA,
E. coli,
Escherichia coli,
Stage,
Tumacácori National Historical Park,
This dataset contains csv files in support of the conclusions published in "Water use demand in Mediterranean California under multiple scenarios of developed and agricultural land use " in the journal PLOS One. We used the USGS's LUCAS model to examine a broad suite of spatially explicit future land use scenarios and their associated county-level water use demand, including the historical (1992-2011) and projected periods (2012-2062) across 40 Monte Carlo simulations.We examined a range of potential water demand futures sampled from a 20-year record of historical (1992-2012) data to develop a suite of potential future land change scenarios from 2012-2062. These scenario simulations include a 1) business-as-usual...
Categories: Data;
Tags: California,
California,
Central Valley,
LUCAS model,
land use and land cover change,
This dataset provides shapefile outlines of the 7,150 lakes that had temperature modeled as part of this study. The format is a shapefile for all lakes combined (.shp, .shx, .dbf, and .prj files). A csv file of lake metadata is also included. This dataset is part of a larger data release of lake temperature model inputs and outputs for 7,150 lakes in the U.S. states of Minnesota and Wisconsin (http://dx.doi.org/10.5066/P9CA6XP8).
Categories: Data;
Types: Downloadable,
Map Service,
OGC WFS Layer,
OGC WMS Layer,
Shapefile;
Tags: IA,
IL,
IN,
Illinois,
Indiana,
This dataset includes spreadsheets with statistical data (mean and median absolute error) used in deciding which interpolation method best fit the corresponding dataset. All statistical data were paired with a visual inspection of the interpolation prior to determining the final raster product. All spreadsheets were generated using an automated python script (Jahn, 2020).
This dataset includes well logs used in the creation of the Cortland hydrogeologic framework. Well logs were used from multiple sources (DEC, DOT, NWIS) and were a crucial component in generating hydrogeologic layer elevations and thicknesses. Well logs are available in their original form on GeoLog Locator (https://webapps.usgs.gov/GeoLogLocator/#!/) and provided here in the digitized form (shapefiles and feature classes), which were used in the generation of the hydrogeologic framework.
Digital hydrogeologic datasets were developed for the Rondout-Neversink study area in upstate New York in cooperation with the New York State Department of Environmental Conservation. These datasets define the hydrogeologic framework of the valley-fill aquifer and surrounding till-covered uplands within the study area. Datasets include: bedrock elevation raster, lacustrine silt and clay top and bottom elevation rasters, lidar minimum elevation raster, lacustrine extent polygon, valley-fill extent polygon, and surficial geology polygons. Elevation layers were interpolated at 125-foot discretization to match the model grid cell size.
This dataset includes well logs used in the creation of the Olean hydrogeologic framework. Well logs were used from multiple sources (DEC, DOT, NWIS, ESOGIS, and recently digitized archived material) and were a crucial component in generating hydrogeologic layer elevations and thicknesses. Well logs are available in their original form on GeoLog Locator (https://webapps.usgs.gov/GeoLogLocator/#!/) and provided here in the digitized form (shapefiles and feature classes), which were used in the generation of the hydrogeologic framework.
This dataset includes "smoothing points" used in the creation of the Jamestown hydrogeologic framework. Smoothing points were manually added and were used to enhance interpolated layers using geologic assumptions and include: valley edge points, centerline bedrock points, and upland bedrock SSURGO points.
The town of Greene is located in Chenango County, New York. Previous USGS reports here include Open-File Report 2003-242 (Hetcher and others, 2003), and Scientific Investigations Map 2914 (Hetcher-Aguila and Miller, 2005). The five child pages below break the data up into georeferenced and digitized previous report data, interpreted geologic information, well logs, supplemental point data, and interpolation statistics.
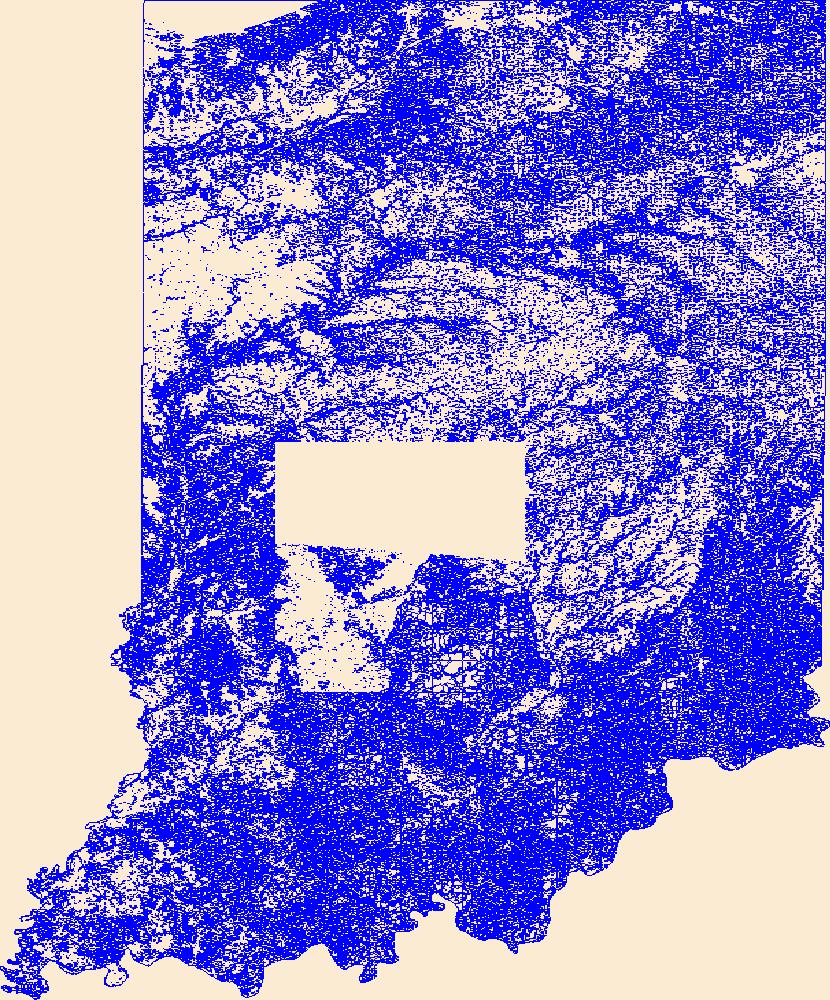
Geospatial data that is a derivative land cover product depicting woodland on topographic maps.
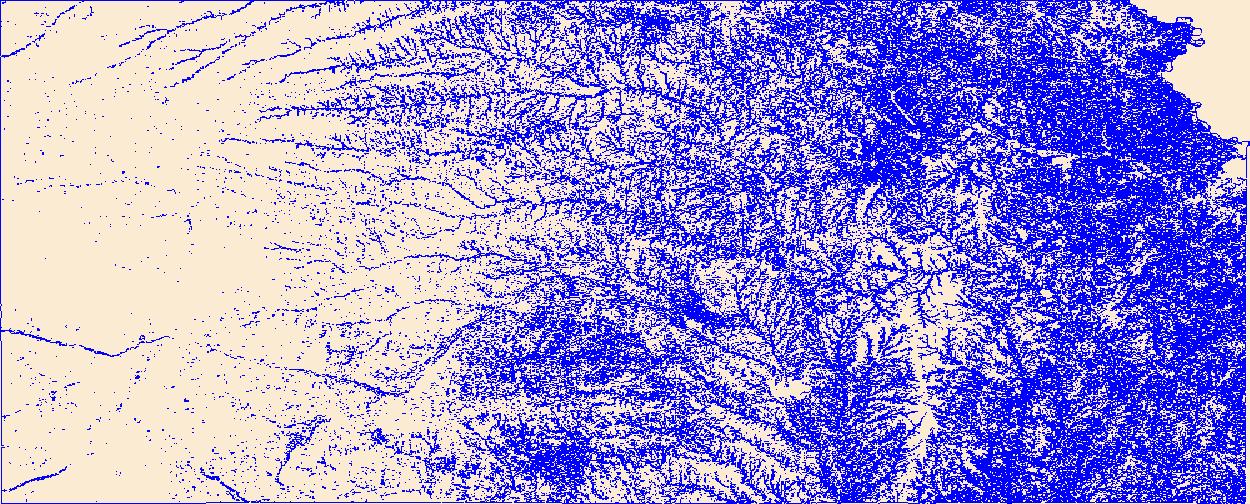
Geospatial data that is a derivative land cover product depicting woodland on topographic maps.
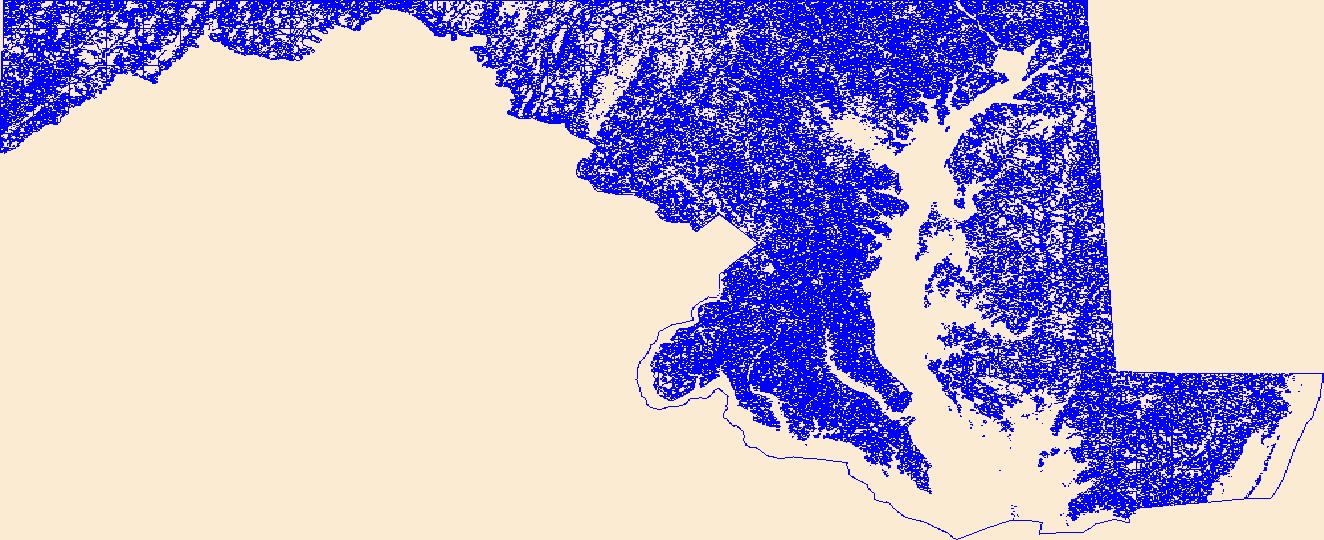
Geospatial data that is a derivative land cover product depicting woodland on topographic maps.
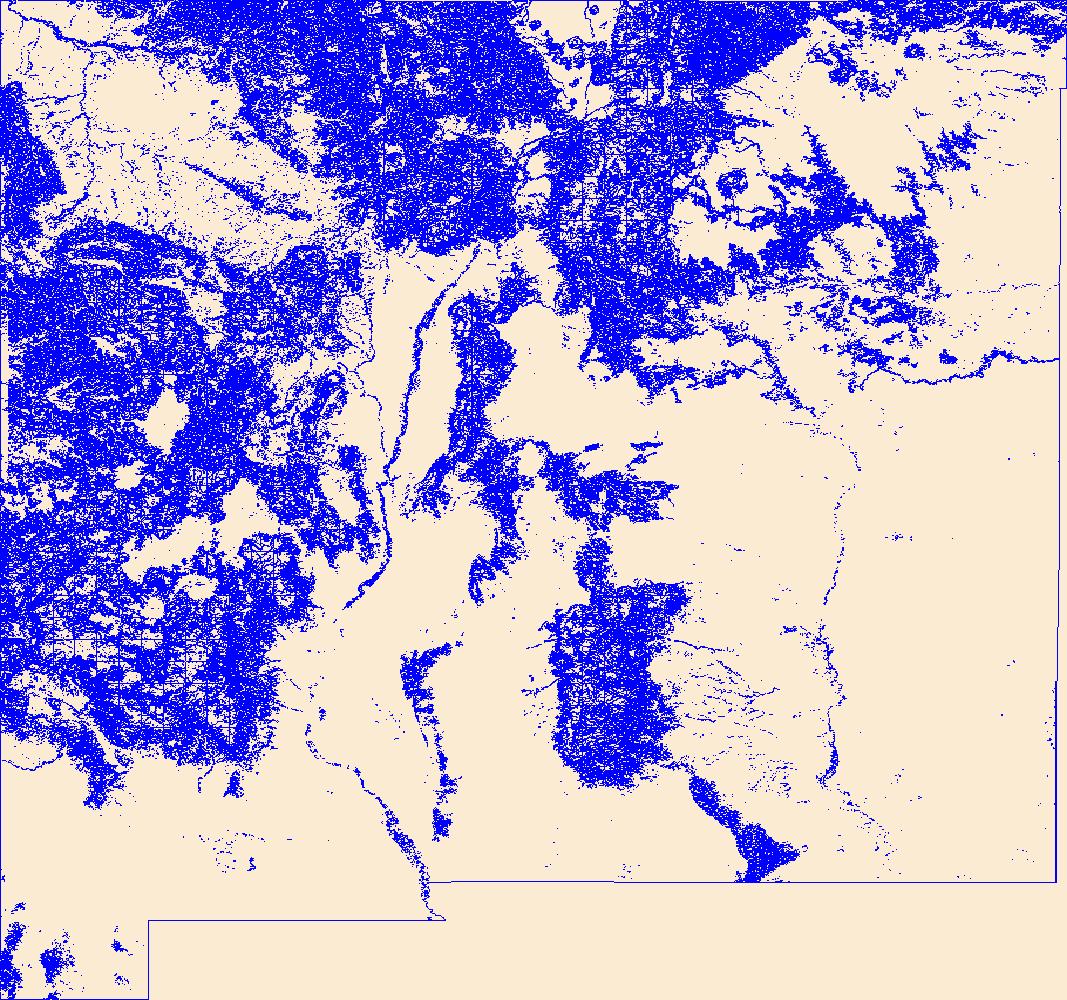
Geospatial data that is a derivative land cover product depicting woodland on topographic maps.
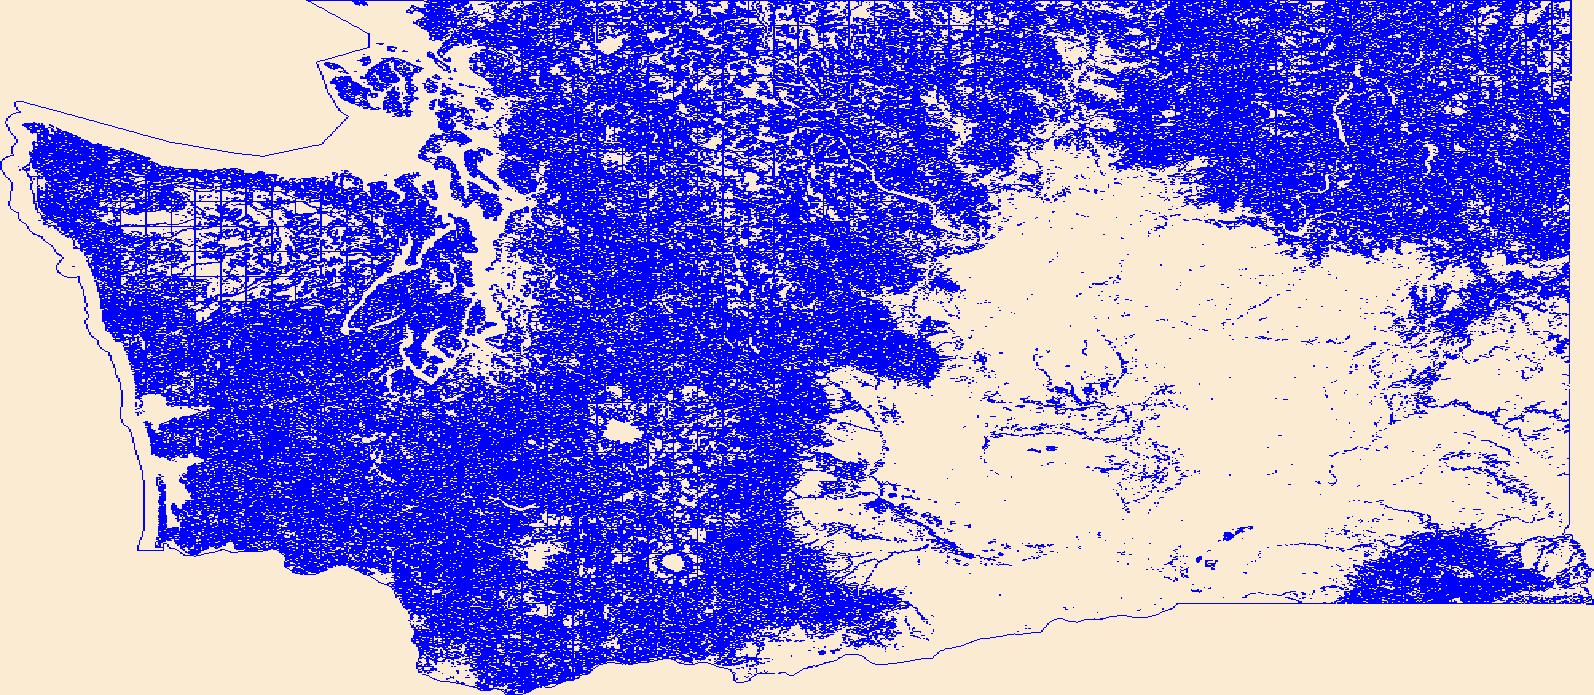
Geospatial data that is a derivative land cover product depicting woodland on topographic maps.
|

|
