Filters: Tags: Water Resources (X) > Date Range: {"choice":"month"} (X)
136 results (192ms)|
Filters
Date Types (for Date Range)
Types
Contacts
Categories Tag Types Tag Schemes |
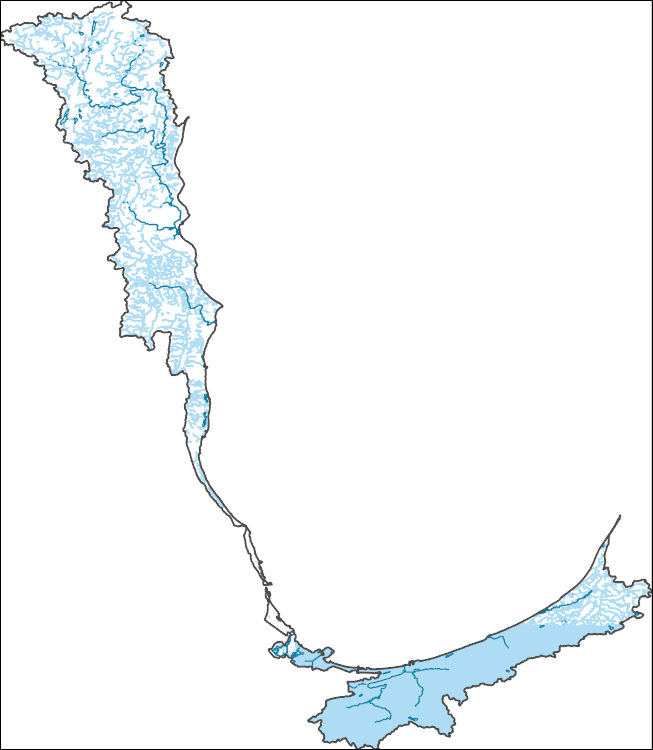
Daily maximum water temperature predictions in the Delaware River Basin (DRB) can inform decision makers who can use cold-water reservoir releases to maintain thermal habitat for sensitive fish species. This data release contains the forcings and outputs of 7-day ahead maximum water temperature forecasting models that makes predictions at 70 river reaches in the upper DRB. The modeling approach includes process-guided deep learning and data assimilation (Zwart et al., 2023). The model is driven by weather forecasts and observed reservoir releases and produces maximum water temperature forecasts for the issue day (day 0) and 7 days into the future (days 1-7). In combination with data provided in Oliver et al. (2022),...
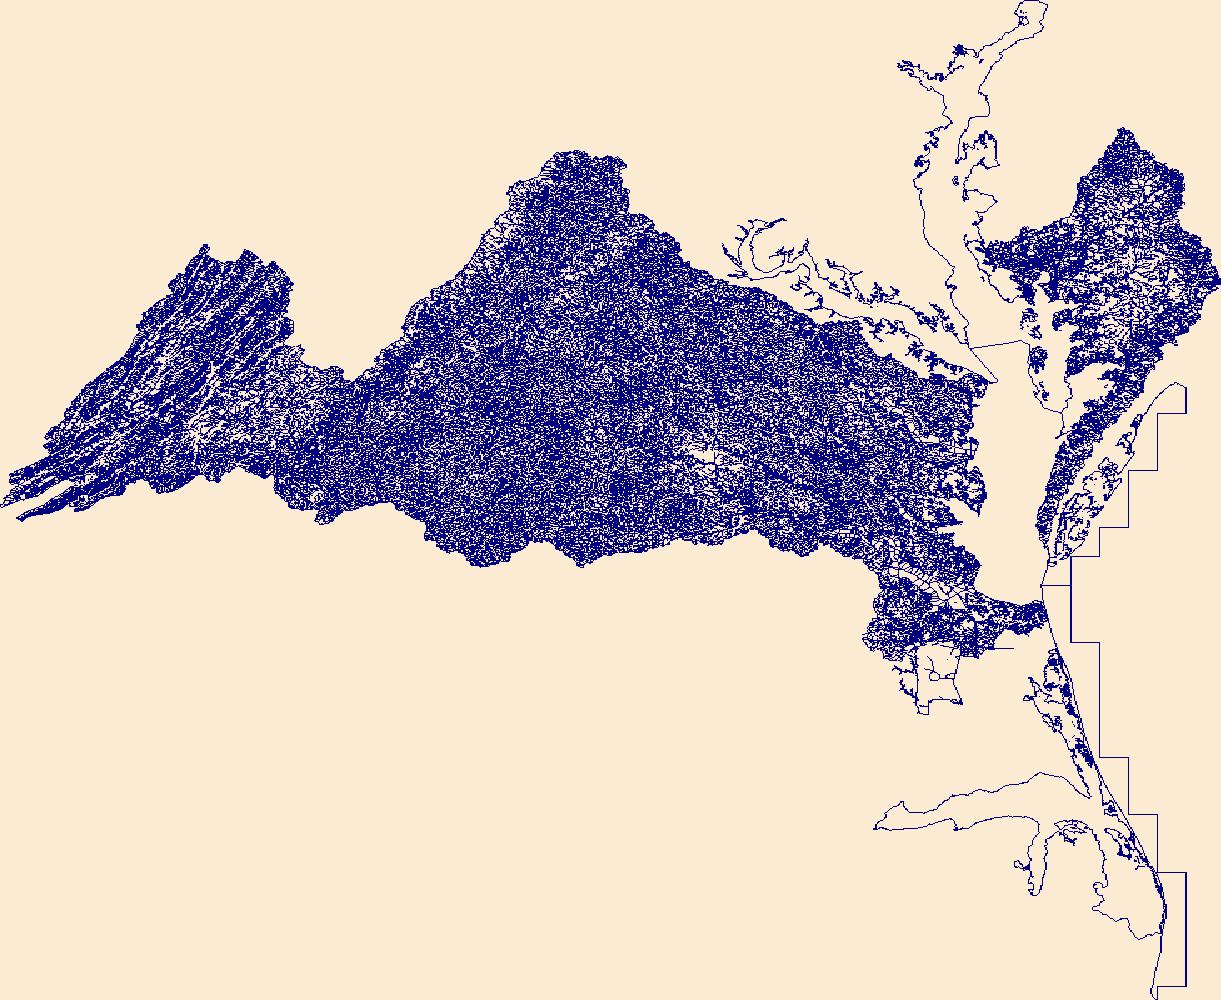
The Coupled Ocean-Atmosphere-Wave-Sediment Transport (COAWST Warner and others, 2019; Warner and others, 2010) model was used to simulate three-dimensional hydrodynamics and waves to study salinity intrusion in the Delaware Bay estuary for 2016, 2018, 2021. Salinity intrusion in coastal systems is due in part to extreme events like drought or low-pressure storms and longer-term sea level rise, threatening economic infrastructure and ecological health. Along the eastern seaboard of the United States, approximately 13 million people rely on the water resources of the Delaware River basin, which is actively managed to suppress the salt front (or ~0.52 daily averaged psu line) through river discharge targets. However,...
This data release contains daily gridded data reflecting surface water input from rainfall, rain on snow (mixed), and snowmelt for the conterminous United States for water years 1990 to 2023 (1990/10/01 to 2023/09/30). This release also contains annual estimates of gridded input seasonality (an index reflecting whether surface water input occurs within a concentrated period or is equally distributed throughout the year), precipitation seasonality, average snowmelt, rainfall and rain on snow rates, and finally, annual totals of each input type. Average snowmelt, rainfall and rain on snow rates were computed using days where values were greater than zero. Daily data were generated using precipitation input from the...
The High Resolution National Hydrography Dataset Plus (NHDPlus HR) is an integrated set of geospatial data layers, including the National Hydrography Dataset (NHD), National Watershed Boundary Dataset (WBD), and 3D Elevation Program Digital Elevation Model (3DEP DEM). The NHDPlus HR combines the NHD, 3DEP DEMs, and WBD to a data suite that includes the NHD stream network with linear referencing functionality, the WBD hydrologic units, elevation-derived catchment areas for each stream segment, "value added attributes" (VAAs), and other features that enhance hydrologic data analysis and routing.
The data are a long-term (1980-present), daily reanalysis of reference evapotranspiration, covering the globe at a spatial resolution of 0.625° Longitude x 0.5° Latitude. Reference evapotranspiration is a measure of evaporative demand, or the "thirst of the atmosphere", basically how much moisture from the surface could evaporate into overpassing air, assuming (i) that enough water is available to evaporate and (ii) the surface is covered with a specific reference crop that completely shades the ground (some other conditions also apply). For this dataset, reference evapotranspiration is derived from the daily implementation of the Penman-Monteith reference evapotranspiration equation (Monteith, 1965) as codified...
Categories: Data,
Data Release - Revised;
Types: Downloadable,
Map Service,
OGC WFS Layer,
OGC WMS Layer,
OGC WMS Service,
Raster;
Tags: Climatology,
Remote Sensing,
USGS Science Data Catalog (SDC),
Water Resources,
climatologyMeteorologyAtmosphere,
These data were compiled for modeling efforts of Bureau of Reclamation National Environmental Policy Act (NEPA) analyses for the Colorado River in Grand Canyon, Arizona. Objective(s) of our study were to forecast water temperature, smallmouth bass population growth rate, and smallmouth bass entrainment rates under different water management scenarios. These data represent forecasted smallmouth bass entrainment rates and smallmouth bass population growth rates. Data were collected in 2023 and 2024 by the Bureau of Reclamation CRMMS and then used by the U.S. Geological Survey-Southwest Biological Science Center-Grand Canyon Monitoring & Research Center in the modeling process. These data can be used to evaluate different...
These data were compiled to predict economic impacts to angling in Glen Canyon and whitewater rafting in Grand Canyon. The objective of our study was to estimate recreation impacts, or changes in consumer surplus, under different future Interim Guidelines sEIS and LTEMP sEIS alternatives. These data include monthly impacts in nominal 2022 dollars. These data were created for operations at Glen Canyon Dam for October 2023 through November 2027. These data were created by the U.S. Geological Survey, Southwest Biological Science Center, Grand Canyon Monitoring and Research Center using mathematical modeling methods.
These data were compiled to assess potential impacts of altered operations of Glen Canyon Dam on riparian plant resources. Objective(s) of our study were to quantify potential responses of specific vegetation metrics. These data represent predicted changes in vegetation metrics based on the data in the Interim Guidelines and LTEMP_SEIS folders. These data were collected in Grand Canyon and Glen Canyon below the dam from 2014-2019. These data were collected by USGS SBSC scientists through ground-based vegetation surveys. These data can be used to predict responses of vegetation metrics only to the specific alterations to dam operations that were simulated.

The High Resolution National Hydrography Dataset Plus (NHDPlus HR) is an integrated set of geospatial data layers, including the National Hydrography Dataset (NHD), National Watershed Boundary Dataset (WBD), and 3D Elevation Program Digital Elevation Model (3DEP DEM). The NHDPlus HR combines the NHD, 3DEP DEMs, and WBD to a data suite that includes the NHD stream network with linear referencing functionality, the WBD hydrologic units, elevation-derived catchment areas for each stream segment, "value added attributes" (VAAs), and other features that enhance hydrologic data analysis and routing.
This dataset includes otolith and water chemistry used for determining natal origins of individuals from six species. The dataset contains Sr:Ca and Ba:Ca of water samples for the Mississippi River and tributaries as well as otolith Sr, Ba, Mg values from fishes collected in navigation pools 4, 8, 13, and 26 of the Upper Mississippi River, as well as the Open River Reach of the Middle Mississippi River and the La Grange Pool of the Illinois River. Fishes included Bullhead Minnow, Emerald Shiner, Gizzard Shad, Bluegill, Orangespotted Sunfish, and Yellow Perch. Laser ablation inductively coupled mass spectrometry to quantify natal origins of these prey fish. Upwards of 50-75% of individuals at a given river reach...
The High Resolution National Hydrography Dataset Plus (NHDPlus HR) is an integrated set of geospatial data layers, including the best available National Hydrography Dataset (NHD), the 10-meter 3D Elevation Program Digital Elevation Model (3DEP DEM), and the National Watershed Boundary Dataset (WBD). The NHDPlus HR combines the NHD, 3DEP DEMs, and WBD to create a stream network with linear referencing, feature naming, "value added attributes" (VAAs), elevation-derived catchments, and other features for hydrologic data analysis. The stream network with linear referencing is a system of data relationships applied to hydrographic systems so that one stream reach "flows" into another and "events" can be tied to and traced...
Peak-flow frequency analysis is crucial in various water-resources management applications, including floodplain management and critical structure design. Federal guidelines for peak-flow frequency analyses, provided in Bulletin 17C, assume that the statistical properties of the hydrologic processes driving variability in peak flows do not change over time and so the frequency distribution of annual peak flows is stationary. Better understanding of long-term climatic persistence and further consideration of potential climate and land-use changes have caused the assumption of stationarity to be reexamined. This data release contains input data and results of a study investigating hydroclimatic trends in peak streamflow...
Previous work by the U.S. Geological Survey (USGS) developed models to estimate the amount of water that is withdrawn and consumed by thermoelectric power plants (Diehl and others, 2013; Diehl and Harris, 2014; Harris and Diehl, 2019 [full citations listed in srcinfo of the metadata file]). This data release presents a historical reanalysis of thermoelectric water use from 2008 to 2020 and includes monthly and annual water withdrawal and consumption estimates, thermodynamically plausible ranges of minimum and maximum withdrawal and consumption estimates, and associated information for 1,360 water-using, utility-scale thermoelectric power plants in the United States. The term “reanalysis” refers to the process of...
This NetCDF represents the monthly inputs and outputs from a United States Geological Survey water-balance model (McCabe and Wolock, 2011) for the conterminous United States for the period 1895-01-01 to 2020-12-31. The source data used to run the water balance model is based on the National Oceanic and Atmospheric Administration's(Vose and others, 2020) ClimGrid data for precipitation and temperature. This NetCDF contains the following monthly inputs: temperature (degrees Celsius) and precipitation (millimeters, mm) and the following outputs (all in mm): runoff, soil moisture storage, actual evapotranspiration, potential evapotranspiration, snow water equivalent, and snowfall. The spatial reference for this data...
This dataset contains particle starting location files for particle tracking simulations of the Upper Missouri River near Wolf Point, MT using the “Fluvial Particle” particle tracking model (https://doi.org/10.5066/P9K1U4O0). The file “DriftExperiment_StartLocations_n30000.csv” corresponds to particle simulations of a July 1, 2019, larval drift experiment. This file is configured to simulate 30,000 particles run in serial (i.e., 30,000 particles run on a single CPU). The files “ReachComparison_StartLocations_Lower_n250.csv” and “ReachComparison_StartLocations_Upper_n250.csv” correspond to particle simulations comparing the upper and lower sub-reaches of the larger model reach. Each of these simulations also used...
This dataset contains two- and quasi-three-dimensional hydrodynamic model outputs from the Flow and Sediment Transport with Morphologic Evolution of CHannels (FaSTMECH) hydrodynamic model in the open source binary Visualization Toolkit (VTK) format (https://vtk.org/). The simulations were run at 348 cms as measured on July 1, 2019, during a larval drift experiment conducted on the Upper Missouri River near Wolf Point, MT. Three different variations of the model were run at multiples of 0.5, 1, and 2 times the calculated lateral eddy viscosity (LEV) value to account for uncertainty in this parameter. These are labeled as LEVx0p5, LEVx1, and LEVx2 respectively. Files can be opened using the open-source software program...
This dataset contains shapefiles for three longitudinal water surface elevation profiles collected by boat on the Upper Missouri River near Wolf Point, MT between June 2018 and July 2019. The dataset was collected to calibrate a multidimensional hydrodynamic model.
The USGS, in cooperation with the U.S. Bureau of Land Management (BLM), created a series of geospatial mapping products of the Scotts Creek Watershed in Lake County, California, using National Agriculture Imagery Program (NAIP) imagery from 2018, 2020 and 2022 and Open Street Map (OSM) from 2019. The imagery was downloaded from United States Department of Agriculture (USDA) - Natural Resources Conservation Service (NRCS) Geospatial Data Gateway (https://datagateway.nrcs.usda.gov/) and Geofabrik GmbH - Open Street Map (https://www.geofabrik.de/geofabrik/openstreetmap.html), respectively. The imagery was classified using Random Forest (RF) Modeling to produce land cover maps with three main classifications - bare,...
The High Resolution National Hydrography Dataset Plus (NHDPlus HR) is an integrated set of geospatial data layers, including the best available National Hydrography Dataset (NHD), the 10-meter 3D Elevation Program Digital Elevation Model (3DEP DEM), and the National Watershed Boundary Dataset (WBD). The NHDPlus HR combines the NHD, 3DEP DEMs, and WBD to create a stream network with linear referencing, feature naming, "value added attributes" (VAAs), elevation-derived catchments, and other features for hydrologic data analysis. The stream network with linear referencing is a system of data relationships applied to hydrographic systems so that one stream reach "flows" into another and "events" can be tied to and traced...
This data release provides a monthly irrigation water use reanalysis for the period 2000-20 for all USGS Watershed Boundary Dataset of Subwatersheds (HUC12) in the conterminous United States (CONUS). Results include reference evapotranspiration (ETo), actual evapotranspiration (ETa), irrigated areas, consumptive use, and effective precipitation for each HUC12. ETo and ETa were estimated using the operational Simplified Surface Energy Balance (SSEBop, Senay and others, 2013; Senay and others, 2020) model executed in the OpenET (Melton and others, 2021) web-based application implemented in Google Earth Engine. Results provided by OpenET/SSEBop were summarized to hydrologic response units (HRUs) in the National Hydrologic...
Categories: Data;
Types: Map Service,
OGC WFS Layer,
OGC WMS Layer,
OGC WMS Service;
Tags: Conterminous United States (CONUS),
Geography,
Hydrology,
USGS Science Data Catalog (SDC),
Water Resources,
|

|
