Filters: Tags: Watersheds (X)
348 results (85ms)|
Filters
Date Range
Extensions
Types
Contacts
Categories Tag Types
|
The High Resolution National Hydrography Dataset Plus (NHDPlus HR) is an integrated set of geospatial data layers, including the National Hydrography Dataset (NHD), National Watershed Boundary Dataset (WBD), and 3D Elevation Program Digital Elevation Model (3DEP DEM). The NHDPlus HR combines the NHD, 3DEP DEMs, and WBD to a data suite that includes the NHD stream network with linear referencing functionality, the WBD hydrologic units, elevation-derived catchment areas for each stream segment, "value added attributes" (VAAs), and other features that enhance hydrologic data analysis and routing.
This dataset represents the historical mean annual area burned per ~ 4 km pixel, averaged for each HUC5 watershed, simulated by the model MC1 for the 30-year period 1971-2000. Historical mean area burned per year (in square meters) per ~4 km pixel was averaged across each HUC5 watershed. Watersheds represent 5th level (HUC5, 10-digit) hydrologic unit boundaries and were acquired from the Natural Resources Conservation Service. Background: The dynamic global vegetation model MC1 (see Bachelet et al.2001) was used to simulate vegetation dynamics, associated carbon and nitrogen cycle, water budget, and wild fire impacts for OR, WA, AZ and NM, for a project funded by the USDA Forest Service (PNW09-JV-11261900-003)....
Percent change in the average annual precipitation for each HUC5 watershed between historical (1971-2000) and future (2071-2100) time periods. The MC1 dynamic vegetation model was run under the CSIRO, MIROC, and Hadley climate change projections and the A2 anthropogenic emissions scenario. Simulated mean annual precipitation (in mm H2O yr-1), was determined for each HUC5 watershed by averaging values of original ~ 4 km raster data. Watersheds represent 5th level (HUC5, 10-digit) hydrologic unit boundaries and were acquired from the Natural Resources Conservation Service. Background: The dynamic global vegetation model MC1 (see Bachelet et al. 2001) was used to simulate vegetation dynamics, associated carbon...
Percent change in the average potential evaporation for each HUC5 watershed between historical (1971-2000) and future (2071-2100) time periods. The MC1 dynamic vegetation model was run under the CSIRO, MIROC, and Hadley climate change projections and the A2 anthropogenic emissions scenario. Simulated mean potential evaporation (in mm H2O yr-1), was determined for each HUC5 watershed by averaging values of original ~ 4 km raster data. Watersheds represent 5th level (HUC5, 10-digit) hydrologic unit boundaries and were acquired from the Natural Resources Conservation Service. Background: The dynamic global vegetation model MC1 (see Bachelet et al. 2001) was used to simulate vegetation dynamics, associated carbon...
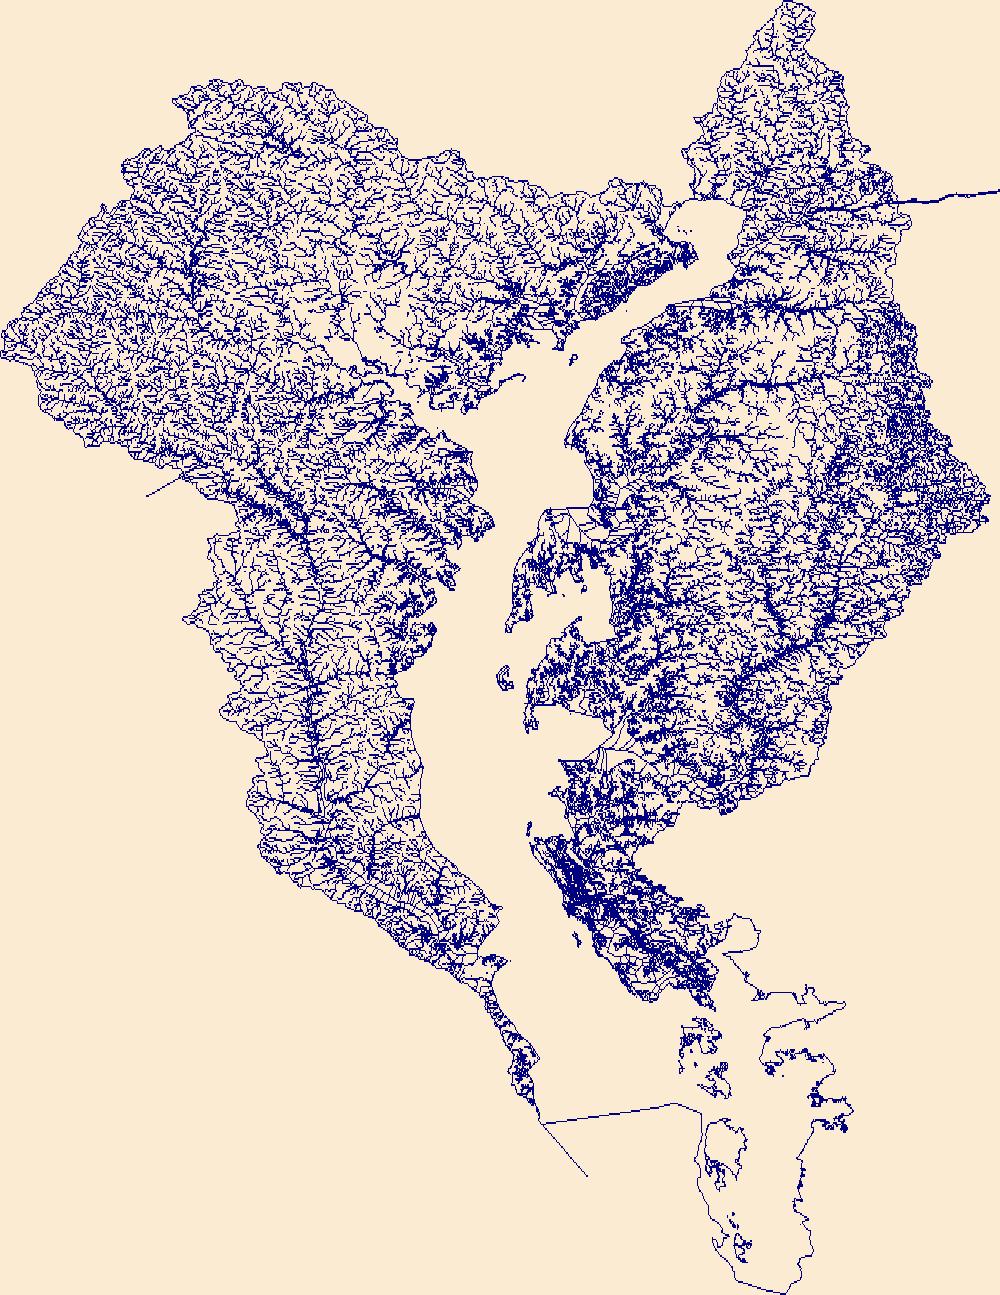
This dataset was developed as part of the research for a Royal Roads University master's thesis entitled "Assessing the impact of human activities on British Columbia’s estuaries". The work was also published through PLOS One (Robb, 2014). The estuary polygons were created by the Pacific Estuary Conservation Program (PECP). Please see Ryder et al., 2007 for more information on their creation. This dataset includes a subset of the PECP estuary dataset because only those estuary polygons that could be linked to to a unique watershed were considered in the analysis. The attributes for each estuary polygon show the spatial coverage of different human activities within the bounds of the estuary and its upstream watershed....
Categories: Data;
Types: ArcGIS REST Map Service,
ArcGIS Service Definition,
Downloadable,
Map Service;
Tags: British Columbia,
Cluster analysis,
Estuaries,
Human activities,
PCEP,
The High Resolution National Hydrography Dataset Plus (NHDPlus HR) is an integrated set of geospatial data layers, including the best available National Hydrography Dataset (NHD), the 10-meter 3D Elevation Program Digital Elevation Model (3DEP DEM), and the National Watershed Boundary Dataset (WBD). The NHDPlus HR combines the NHD, 3DEP DEMs, and WBD to create a stream network with linear referencing, feature naming, "value added attributes" (VAAs), elevation-derived catchments, and other features for hydrologic data analysis. The stream network with linear referencing is a system of data relationships applied to hydrographic systems so that one stream reach "flows" into another and "events" can be tied to and traced...
The High Resolution National Hydrography Dataset Plus (NHDPlus HR) is an integrated set of geospatial data layers, including the best available National Hydrography Dataset (NHD), the 10-meter 3D Elevation Program Digital Elevation Model (3DEP DEM), and the National Watershed Boundary Dataset (WBD). The NHDPlus HR combines the NHD, 3DEP DEMs, and WBD to create a stream network with linear referencing, feature naming, "value added attributes" (VAAs), elevation-derived catchments, and other features for hydrologic data analysis. The stream network with linear referencing is a system of data relationships applied to hydrographic systems so that one stream reach "flows" into another and "events" can be tied to and traced...
The High Resolution National Hydrography Dataset Plus (NHDPlus HR) is an integrated set of geospatial data layers, including the best available National Hydrography Dataset (NHD), the 10-meter 3D Elevation Program Digital Elevation Model (3DEP DEM), and the National Watershed Boundary Dataset (WBD). The NHDPlus HR combines the NHD, 3DEP DEMs, and WBD to create a stream network with linear referencing, feature naming, "value added attributes" (VAAs), elevation-derived catchments, and other features for hydrologic data analysis. The stream network with linear referencing is a system of data relationships applied to hydrographic systems so that one stream reach "flows" into another and "events" can be tied to and traced...
|

|
