Filters: Tags: watershed (X) > Types: Map Service (X)
153 results (17ms)|
Filters
Date Range
Extensions
Types
Contacts
Categories Tag Types Tag Schemes |
This dataset provides the results of an assessment of estuary habitat condition in the conterminous United States. To analyze estuary condition, a cumulative disturbance index was developed based on habitat stressor variable data available at a national scale for anthropogenic disturbances measured within estuaries and their associated watersheds. Twenty-eight variables were combined within stressor categories to develop four sub-indices of disturbance for land use, alterations of river flows, pollution sources, and estuary eutrophication. These four sub-indices of disturbance were then combined to develop cumulative disturbance index scores for each estuary. This index describes the estimated combined stress on...

Description of Work Benthos (benthic invertebrate) and plankton (phytoplankton/zooplankton) communities in Wisconsin's four Lake Michigan Areas of Concern (AOCs; Menominee River, Lower Green Bay and Fox River, Sheboygan River, and Milwaukee Estuary) and six non-AOCs will be quantified. The inclusion of non-AOC sites will allow comparison of AOC sites to relatively-unimpacted or less-impacted control sites with natural physical and chemical characteristics that are as close as possible to that of the AOCs. The community data within and between the AOCs and non-AOCs will be analyzed. This project is a cooperative agreement between the Wisconsin Department of Natural Resources (WDNR) and the US Geological Survey (USGS)....
Categories: Project;
Types: Map Service,
OGC WFS Layer,
OGC WMS Layer,
OGC WMS Service;
Tags: AOC,
Areas of concern,
Beneficial use impairment,
Ecosystem health,
Fox River,

Description of Work USGS will conduct seasonal sampling of benthic invertebrates, zooplankton, prey fish, and their diets to complement the seasonal lower trophic level sampling by EPA. A point of emphasis is describing the vertical distribution of planktivores and their zooplankton prey, to fill a knowledge gap on these predator/prey interactions. These data will provide a more holistic understanding of how invasive-driven, food-web changes could be altering energy available to sport fishes in the Great Lakes and used to build bioenergetics models that can evaluate whether zooplankton dynamics are being driven by limited resources or excessive predation. Understanding the key drivers of zooplankton will provide...
Categories: Project;
Types: Map Service,
OGC WFS Layer,
OGC WMS Layer,
OGC WMS Service;
Tags: Accountability,
CSMI,
Ecosystem health,
Energy transfer,
Fish production,
Regional regression equations were calculated in Puerto Rico with generalized least squares techniques to estimate flood frequency statistics at ungaged locations using drainage area as the only explanatory variable. The island was divided into 2 regions to minimize residuals. The region division that resulted in lower and more balanced residuals runs primarily north-south near the center of the island, mostly along an 8-digit hydrologic unit code (HUC8) boundary. The division line runs through a HUC8 polygon on the southern end of the island, but care was taken to include entire watersheds and consideration was given where hydrologic and physiographic properties differed. This data release includes geographic information...
Types: Map Service,
OGC WFS Layer,
OGC WMS Layer,
OGC WMS Service;
Tags: HUC,
Puerto Rico,
WBD,
Watershed,
Watershed Boundary Dataset,
This data collection consists of a synthetic stream network and associated catchments developed as the foundation for a Spatially Referenced Regressions on Watershed Attributes (SPARROW) dissolved-solids source and transport model for the Upper Colorado River Basin (UCRB). The SPARROW model requires a hydrologically connected representation of a stream network through which loads are transported from an upstream reach to the next reach downstream (Schwarz and others, 2006; Moore and others, 2004). Each stream reach or segment within this synthetic stream network has an associated local drainage area or catchment used to calculate catchment characteristics that may have an effect on loads being modeled. The synthetic...
Categories: Data;
Types: Citation,
Downloadable,
Map Service,
OGC WFS Layer,
OGC WMS Layer,
Shapefile;
Tags: Arizona,
Catchment,
Colorado,
Dissolved-solids model,
Hydrologic network,
Digital datasets were used to develop basin characteristics values that are used in multiple regression equations and tested for the use in predicting flow-duration curves (FDCs) in ungaged areas of Indiana. Several basin characteristics are easily derived from StreamStats basin delineations, such as basin area (https://streamstats.usgs.gov/ss/). Other basin characteristics require ancillary datasets as input. The data provided through this data release are those data that have been collected, tested, and ultimately selected as a basis for FDC development. These include PRISM 3-Month Average Precipitation, Thickness and Coarseness of Quaternary Sediments, and Soil Available Water Capacity. There are 6 continuous...
This dataset includes hourly stream temperature data for 139 temperature logger sites throughout the Lahontan Basin Region of Northern Nevada and Eastern California. Data loggers were part a study beginning in 2017, with data available through 2019 for most locations. The spatial data layer contains site locations, geographic information, data summaries, mean August stream temperatures, and modeled NorWeST stream temperatures. The Wet-Dry delineation file contains daily flow status estimates derived from stream temperature data for each site. The Site Visit file contains the date and time of the site visit along with associated information on site flow conditions, water depths, logger conditions, and stream logger...
Categories: Data;
Types: Downloadable,
Map Service,
OGC WFS Layer,
OGC WMS Layer,
Shapefile;
Tags: Aquatic Biology,
California,
Ecology,
Hydrology,
Intermittent,
This Geographic Information System dataset contains shapefiles of 200-foot stream buffers for the 15 study watersheds in Gwinnett County, Georgia. The stream buffers are based on flowlines from the high resolution, 1:24,000-scale National Hydrography Dataset.
This dataset contains the daily average base flow, as determined by hydrograph separation, for 14 watersheds in Gwinnett County, Georgia for October 2001 through September 2020. Hydrograph separations were done using the Web-based Hydrograph Analysis Tool (WHAT) using the simple local minimum method on the daily average streamflows, which are also provided in this dataset. Base flow along with the calculated base-flow index (the proportion of base flow to total flow) were used to characterize groundwater recharge and the relative degree of storm runoff in the watersheds. Base flow was also used as predictor variable in models for estimating streamwater constituent loads for 12 water-quality constituents at 13 of...
Categories: Data;
Types: Map Service,
OGC WFS Layer,
OGC WMS Layer,
OGC WMS Service;
Tags: Gwinnett County,
State of Georgia,
datasets,
inlandWaters,
streamflow,
This layer has been updated in 2016 This shapefile represents the watersheds present within the Crown of the Continent Ecosystem (CCE) boundary.(Note: a different CCE boundary layer was used at the time of creation, so the area amounts within the CCE may not be accurate)This dataset was developed by the Crown Managers Partnership, as part of a transboundary collaborative management initiative for the Crown of the Continent Ecosystem, based on commonly identified management priorities that are relevant at the landscape scale. The CMP is collaborative group of land managers, scientists, and stakeholder in the CCE. For more information on the CMP and its collaborators, programs, and projects please visit: http://crownmanagers.org/
Categories: Data;
Types: Citation,
Downloadable,
Map Service,
OGC WFS Layer,
OGC WMS Layer,
Shapefile;
Tags: Alberta,
British Columbia,
CCE,
CMP,
Crown Manager's Partnership,
Our objective was to develop a species-distribution model using habitat associations that represent probability of suitable habitat for the species historical range and the range under climate change scenarios including a hot/dry prediction (MIROC3.2) and a cool/wet prediction (ECHAM5) and 1-m and 2-m sea level rise scenarios; urban growth was also inlcuded. Future model predictions were based on extrapolated data for two time steps in the 21st century: mid (2046-2064) and late (2081-2100). Species distributions were modeled with Maxent (Maximum Entropy presence-only algorithm); climate change scenarios were based on precipitation and temperature changes as applied to stream conditions (e.g., flow) modeled with...
Categories: Data;
Types: ArcGIS REST Map Service,
ArcGIS Service Definition,
Downloadable,
Map Service;
Tags: Florida,
GIS,
National Hydrography Dataset,
United States of America,
Watershed,
Collection of 4 assessments for Upland Streams and Rivers. The Condition Index ranks stream segments according to how well they meet the Desired State described qualitatively and quantitatively in the draft Integrated Science Agenda (v4). From the Condition Index, 3 assessments are derived that rank opportunities for management and restoration of conditions included in the Condition Index – Watershed Land Use, Riparian Cover, and Stream Meander. Watershed Land Use management opportunities are based on the proportion of undisturbed land in the contributing (i.e. cumulative) watershed such that stream segments meeting the Desired State are considered Maintenance opportunities (values 5-6). Those that do not meet the...
Final Report - Executive Summary: This final project report is prepared to summarize the research project titled “Assessing evapotranspiration rate changes for proposed restoration of the forested uplands of the Desert Landscape Conservation Cooperatives (LCC)” for the Desert LCC of the Bureau of Reclamation as a requirement for closing out the project. This report includes the scope of work, summary of research project, results, and conclusions.Among all of the components of the terrestrial water cycle, evapotranspiration (ET) consumes the largest amount of water. Accurate estimation of ET is very important to understand the influence of ET to the hydrologic response of recharge and runoff processes in the water...
Categories: Data,
Publication;
Types: Citation,
Map Service,
OGC WFS Layer,
OGC WMS Layer,
OGC WMS Service;
Tags: 2012,
ATMOSPHERE,
ATMOSPHERE,
ATMOSPHERIC WATER VAPOR,
ATMOSPHERIC WATER VAPOR,
This layer represents the number of Tier 1 fish species known to occur in each HUC10 watershed in the state, according to data available in CPW’s fish database as of December 2014. There are 25 fish species on the Tier 1 SGCN list; a maximum of eight different species occur in the same watershed. This map is an indicator of species richness only; it does not consider relative habitat quality, or population metrics such as density or abundance, across watersheds.
Categories: Data;
Types: Citation,
Downloadable,
Map Service,
OGC WFS Layer,
OGC WMS Layer,
Shapefile;
Tags: Basin,
HUC,
HUC12,
Hydrologic Unit Code,
Hydrologic Units,
What are current conditions for important park natural resources? What are the critical data and knowledge gaps? What are some of the factors that are influencing park resource conditions? Natural Resource Condition Assessments (NRCAs) evaluate and report on the above for a subset of important natural resources in national park units (hereafter, parks). Focal study resources and indicators are selected on a park-by-park basis, guided by use of structured resource assessment and reporting frameworks. Considerations include park resource setting and enabling legislation (what are this park's most important natural resources?) and presently available data and expertise (what can be evaluated at this time?). In addition...
Categories: Data;
Types: ArcGIS REST Map Service,
Map Service,
OGC WFS Layer,
OGC WMS Layer,
OGC WMS Service;
Tags: Chihuahuan Desert,
English,
GIS,
Madrean,
Mojave Desert,
Natural landscapes in the Southwestern United States are changing. In recent decades, rising temperatures and drought have led to drier conditions, contributed to large-scale ecological impacts, and affected many plant and animal species across the region. The current and future trajectory of climate change underscores the need for managers and conservation professionals to understand the impacts of these patterns on natural resources. In this regional assessment of the Southwest Climate Change Initiative, we evaluate changes in annual average temperatures from 1951–2006 across major habitats and large watersheds and compare these changes to the number of species of conservation concern that are found within these...
Categories: Publication;
Types: Citation,
Map Service,
OGC WFS Layer,
OGC WMS Layer,
OGC WMS Service;
Tags: Chihuahuan Desert,
English,
Madrean,
Mojave Desert,
Sonoran Desert,
El Espacio Digital Geográfico (ESDIG) de la SEMARNAT, muestra en mapas información sobre las características ambientales y sociales del país en temas como vegetación, uso del suelo, cuerpos de agua, suelos, clima, población, entre otros, así como de los resultados de programas ambientales y sociales dedicados al aprovechamiento, conservación y recuperación de los ecosistemas naturales de México. Los mapas desplegados son extraídos de la base de datos geográfica del SNIARN. La información contenida en ésta base ha sido generada por diferentes áreas de la Semarnat, sus órganos desconcentrados y descentralizados, así como también por el INEGI y diversas dependencias del Gobierno Federal.
Types: Map Service,
OGC WFS Layer,
OGC WMS Layer,
OGC WMS Service;
Tags: GIS,
Mexico,
Spanish,
bird,
climate,
The Gulf of Alaska is one of the most productive marine ecosystems on Earth, supporting salmon fisheries that alone provide nearly $1 billion per year in economic benefits to Southeast Alaska. Glaciers are central to many of the area’s natural processes and economic activities, but the rates of glacier loss in Alaska are among the highest on Earth, with a 26-36 percent reduction in total volume expected by the end of the century. This project brought together scientists and managers at a workshop to synthesize the impacts of glacier change on the region’s coastal ecosystems and to determine related research and monitoring needs. Collected knowledge shows that melting glaciers are expected to have cascading effects...
Categories: Project;
Types: Map Service,
OGC WFS Layer,
OGC WMS Layer,
OGC WMS Service;
Tags: 2012,
Alaska,
Alaska CASC,
Basins,
CASC,
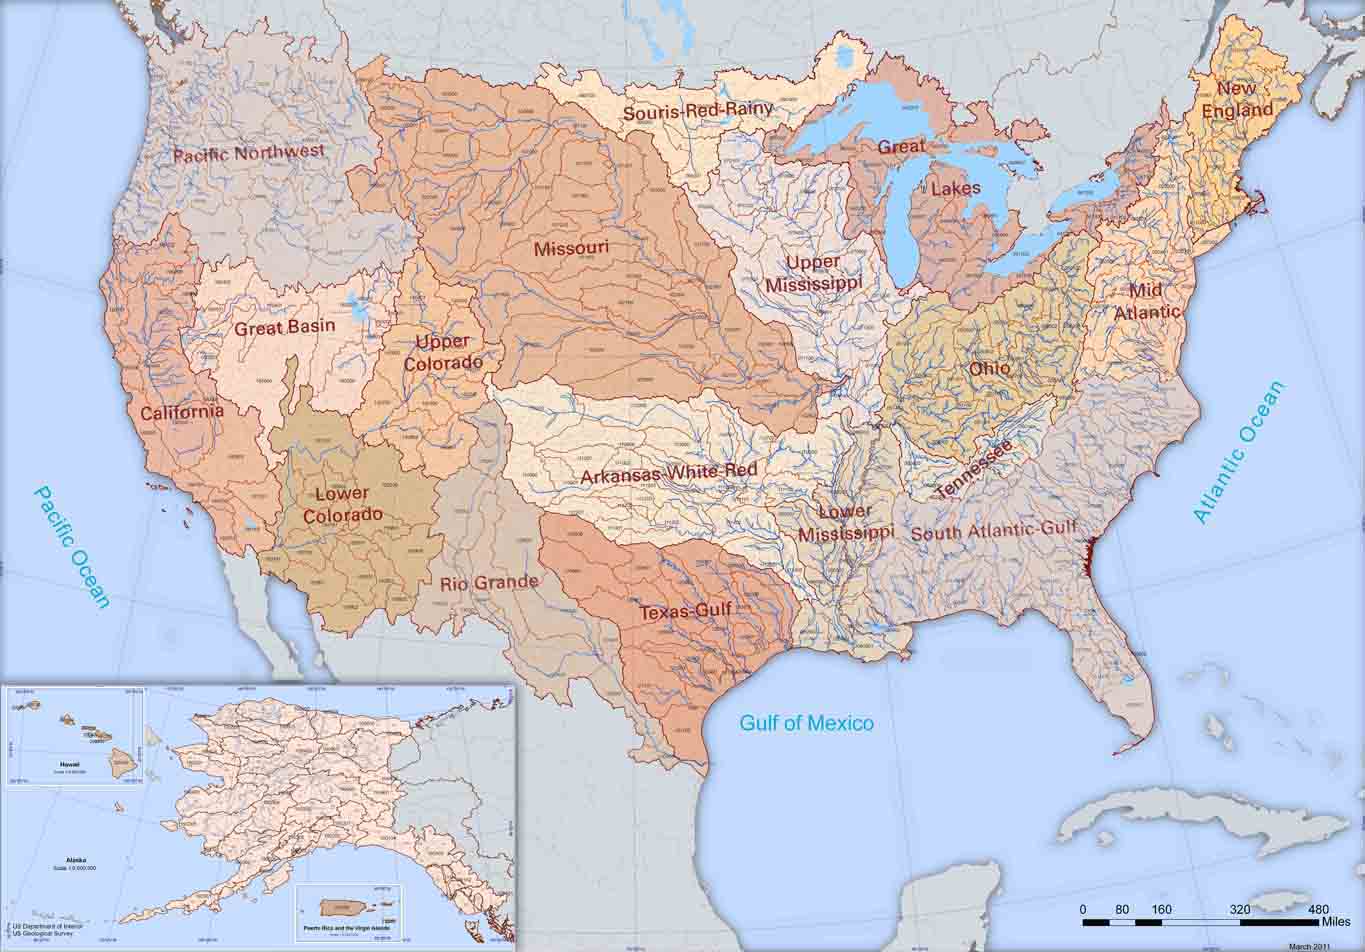
The Watershed Boundary Dataset (WBD) from The National Map (TNM) defines the perimeter of drainage areas formed by the terrain and other landscape characteristics. The drainage areas are nested within each other so that a large drainage area, such as the Upper Mississippi River, will be composed of multiple smaller drainage areas, such as the Wisconsin River. Each of these smaller areas can further be subdivided into smaller and smaller drainage areas. The WBD uses six different levels in this hierarchy, with the smallest averaging about 30,000 acres. The WBD is made up of polygons nested into six levels of data respectively defined by Regions, Subregions, Basins, Subbasins, Watersheds, and Subwatersheds. For additional...
This shapefile contains fish habitat condition index (HCI) scores as well as specific disturbance indices for 6th level Hydrologic Unit Code (HUC12) watersheds of the Watershed Boundary Dataset. The source datasets compiled and attributed to spatial units were identified as being: (1) meaningful for assessing fluvial fish habitat; (2) consistent across the entire study area in the way that they were assembled; (3) broadly representative of conditions in the past 10 years, and (4) of sufficient spatial resolution that they could be used to make valid comparisons among HUC12 units. In this data set, variable summaries are linked to HUC12 watersheds developed for the Watershed Boundary Dataset downloaded on March 18,...
Categories: Data;
Types: ArcGIS REST Map Service,
Map Service;
Tags: 2015 National Assessment,
2015 National Assessment,
DataProduct,
Direct habitat alteration,
Environmental condition,
|

|
