Filters: Tags: {"scheme":"None","name":"contours"} (X) > Tags: {"scheme":"None","name":"inlandwaters"} (X)
19 results (184ms)|
Filters
Date Range
Extensions Types
Contacts
Categories Tag Types Tags (with Scheme=None)
|
Statistical analyses and maps representing mean, high, and low water-level conditions in the surface water and groundwater of Miami-Dade County were made by the U.S. Geological Survey, in cooperation with the Miami-Dade County Department of Regulatory and Economic Resources, to help inform decisions necessary for urban planning and development. Sixteen maps were created that show contours of (1) the mean of daily water levels at each site during October and May for the 2000-2009 water years; (2) the 25th, 50th, and 75th percentiles of the daily water levels at each site during October and May and for all months during 2000-2009; and (3) the differences between mean October and May water levels, as well as the differences...
Categories: Data;
Types: Downloadable,
Map Service,
OGC WFS Layer,
OGC WMS Layer,
Shapefile;
Tags: Biscayne Bay,
Biscayne aquifer,
Florida,
Florida Bay,
Miami-Dade County,
Statistical analyses and maps representing mean, high, and low water-level conditions in the surface water and groundwater of Miami-Dade County were made by the U.S. Geological Survey, in cooperation with the Miami-Dade County Department of Regulatory and Economic Resources, to help inform decisions necessary for urban planning and development. Sixteen maps were created that show contours of (1) the mean of daily water levels at each site during October and May for the 2000-2009 water years; (2) the 25th, 50th, and 75th percentiles of the daily water levels at each site during October and May and for all months during 2000-2009; and (3) the differences between mean October and May water levels, as well as the differences...
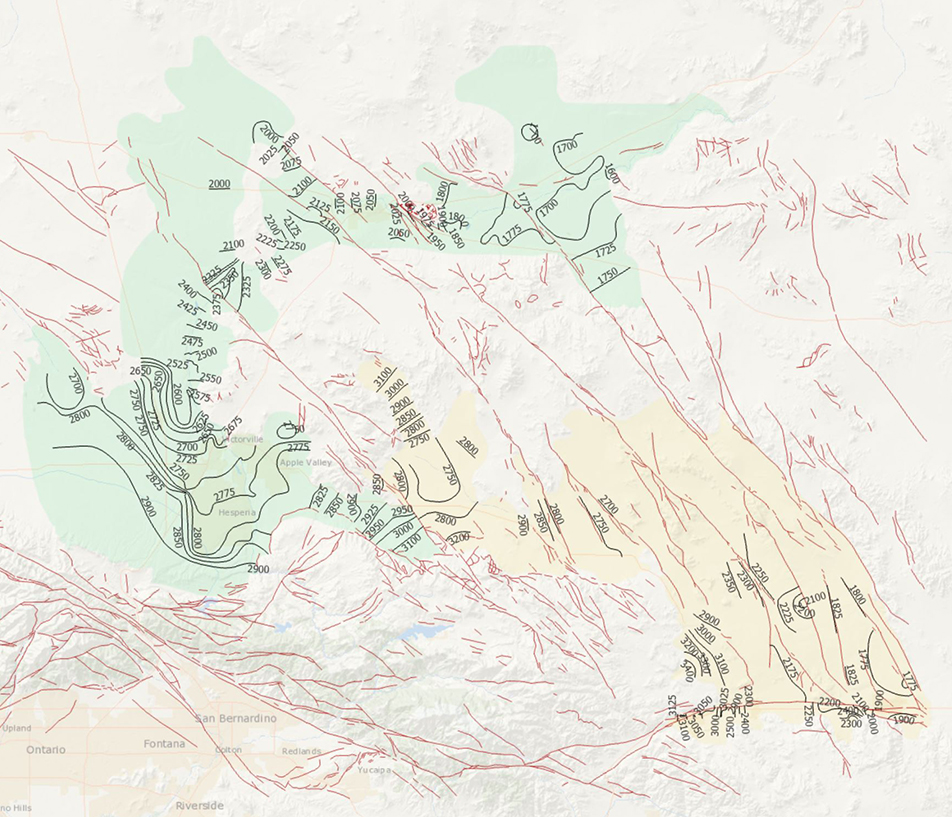
During 2014, the U.S. Geological Survey and other agencies made approximately 1,026 water-level measurements in the Mojave River and Morongo groundwater basins. These data document recent conditions and, when compared with previous data, changes in groundwater levels. A water-level contour map was drawn using data from about 610 wells, providing coverage for most of the basins. Twenty-four hydrographs show long-term (1930-2014) water-level conditions throughout the basins, and 9 short-term (1992 to 2014) hydrographs show the effects of recharge and discharge along the Mojave River. In addition, a water-level-change map was compiled to compare was compiled to compare the 2014 water levels to the 2012 water levels...
Categories: Data Release - Revised;
Tags: USGS,
USGS Science Data Catalog (SDC),
contours,
drainage basin,
ground water,
Statistical analyses and maps representing mean, high, and low water-level conditions in the surface water and groundwater of Miami-Dade County were made by the U.S. Geological Survey, in cooperation with the Miami-Dade County Department of Regulatory and Economic Resources, to help inform decisions necessary for urban planning and development. Sixteen maps were created that show contours of (1) the mean of daily water levels at each site during October and May for the 2000-2009 water years; (2) the 25th, 50th, and 75th percentiles of the daily water levels at each site during October and May and for all months during 2000-2009; and (3) the differences between mean October and May water levels, as well as the differences...
Statistical analyses and maps representing mean, high, and low water-level conditions in the surface water and groundwater of Miami-Dade County were made by the U.S. Geological Survey, in cooperation with the Miami-Dade County Department of Regulatory and Economic Resources, to help inform decisions necessary for urban planning and development. Sixteen maps were created that show contours of (1) the mean of daily water levels at each site during October and May for the 2000-2009 water years; (2) the 25th, 50th, and 75th percentiles of the daily water levels at each site during October and May and for all months during 2000-2009; and (3) the differences between mean October and May water levels, as well as the differences...
Categories: Data;
Types: Downloadable,
Map Service,
OGC WFS Layer,
OGC WMS Layer,
Shapefile;
Tags: Biscayne Bay,
Biscayne aquifer,
Florida,
Florida Bay,
Miami-Dade County,
Statistical analyses and maps representing mean, high, and low water-level conditions in the surface water and groundwater of Miami-Dade County were made by the U.S. Geological Survey, in cooperation with the Miami-Dade County Department of Regulatory and Economic Resources, to help inform decisions necessary for urban planning and development. Sixteen maps were created that show contours of (1) the mean of daily water levels at each site during October and May for the 2000-2009 water years; (2) the 25th, 50th, and 75th percentiles of the daily water levels at each site during October and May and for all months during 2000-2009; and (3) the differences between mean October and May water levels, as well as the differences...
Categories: Data;
Types: Downloadable,
Map Service,
OGC WFS Layer,
OGC WMS Layer,
Shapefile;
Tags: Biscayne Bay,
Biscayne aquifer,
Florida,
Florida Bay,
Miami-Dade County,
|

|
