Filters: Tags: Baffin Bay (X)
5 results (15ms)|
Filters
Date Range
Contacts (Less)
Categories (Less) Tag Types
|
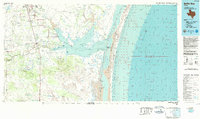
USGS Historical Quadrangle in GeoPDF.
The Sea Surface Temperature (SST) data of the Arctic show temperature ranges in degrees C using points whose locations correspond to the centroids of AVHRR Pathfinder version 5 monthly, global, 4 km data set (PFSST V50). The pathfinder rasters are available from the NOAA National Oceanographic Data Center (NODC) and from the Physical Oceanography Distributed Active Archive Center (PO.DAAC), hosted by NASA JPL. Furthermore, each point in the SST dataset is categorized by the ecoregion in which it is located. This classification is based on the Marine Ecosystems Of the World (MEOW) developed and distributed by The Nature Conservancy. These data have been QA'd in that we have selected only data values with associated...
The Sea Surface Temperature (SST) data of the Arctic show temperature ranges in degrees C using points whose locations correspond to the centroids of AVHRR Pathfinder version 5 monthly, global, 4 km data set (PFSST V50). The pathfinder rasters are available from the NOAA National Oceanographic Data Center (NODC) and from the Physical Oceanography Distributed Active Archive Center (PO.DAAC), hosted by NASA JPL. Furthermore, each point in the SST dataset is categorized by the ecoregion in which it is located. This classification is based on the Marine Ecosystems Of the World (MEOW) developed and distributed by The Nature Conservancy. These data have been QA'd in that we have selected only data values with associated...
The Sea Surface Temperature (SST) data of the Arctic show temperature ranges in degrees C using grid cells of AVHRR Pathfinder version 5 monthly, global, 4 km data set (PFSST V50). The pathfinder rasters are available from the NOAA National Oceanographic Data Center (NODC) and from the Physical Oceanography Distributed Active Archive Center (PO.DAAC), hosted by NASA JPL. These data have been QA'd in that we have selected only data values with associated quality flags of 4-7. No Data values are not included here.
This is an ArcGIS shapefile which depicts the seasonal salinity dynamics of 32 Gulf of Mexico estuaries. To characterize the dynamic nature of estuarine salinity gradients, a multivariate methodology (Bulger et al. 1993) was applied to derive five bio-salinity zones in four salinity seasons for 32 Gulf of Mexico estuaries (Christensen et al. 1997). This seasonal salinity zone spatial framework built upon and refined earlier studies which characterized salinity on an annual-averaged basis (NOAA 1985, Orlando et al. 1993, NOAA 2007). Precipitation, flow gage data, and monthly salinity averages were evaluated to determine which months would be used to represent the high, low, and transitional (increasing and decreasing)...
Categories: Data;
Tags: Academics & scientific researchers,
Apalachee Bay,
Apalachicola Bay,
Aransas Bay,
Atchafalaya Bay,
|

|
