Filters
Date Range
Types
Contacts
Categories
Tag Types
Tag Schemes
|
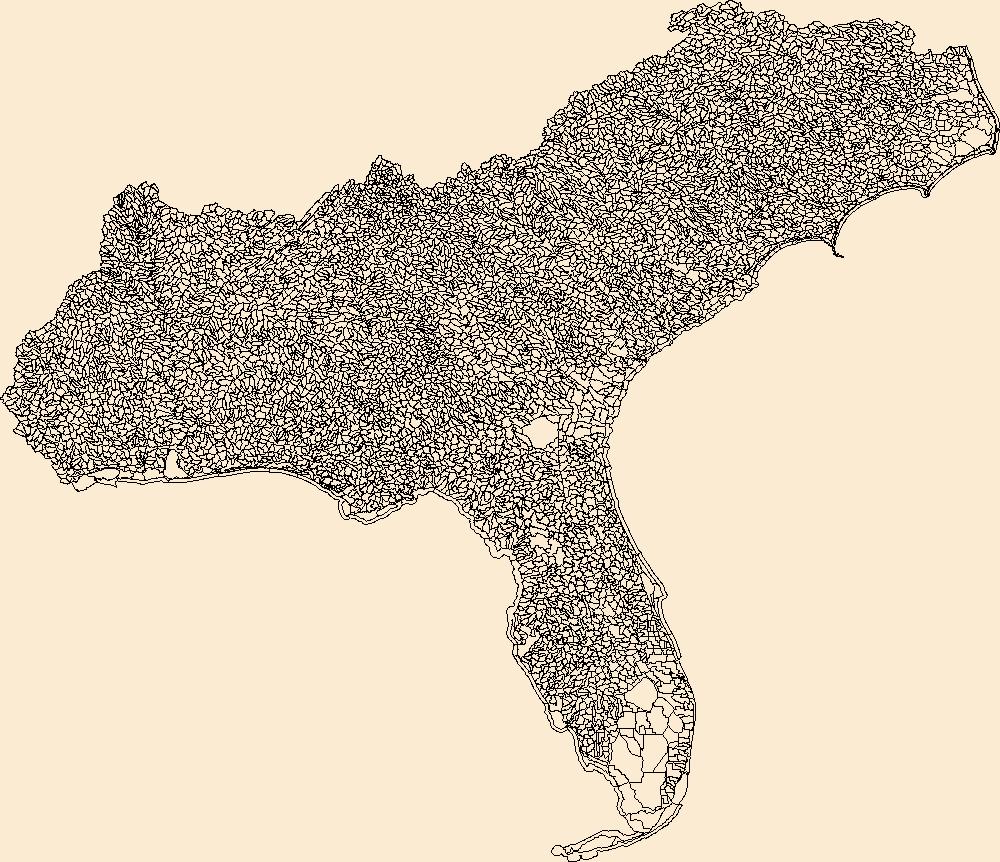
The Watershed Boundary Dataset (WBD) is a comprehensive aggregated collection of hydrologic unit data consistent with the national criteria for delineation and resolution. It defines the areal extent of surface water drainage to a point except in coastal or lake front areas where there could be multiple outlets as stated by the "Federal Standards and Procedures for the National Watershed Boundary Dataset (WBD)" "Standard" (https://pubs.usgs.gov/tm/11/a3/). Watershed boundaries are determined solely upon science-based hydrologic principles, not favoring any administrative boundaries or special projects, nor particular program or agency. This dataset represents the hydrologic unit boundaries to the 12-digit (6th level)...
Tags: 10-digit,
12-digit,
14-digit,
16-digit,
2-digit, All tags...
4-digit,
6-digit,
8-digit,
AL,
Abbeville,
Aiken,
Alabama,
Alachua,
Alamance,
Alexander,
Alleghany,
Allendale,
Anderson,
Anson,
Appling,
Appomattox,
Ashe,
Atkinson,
Attala,
Autauga,
Avery,
Bacon,
Baker,
Baldwin,
Bamberg,
Banks,
Barbour,
Barnwell,
Barrow,
Bartow,
Basin,
Bay,
Beaufort,
Bedford,
Ben Hill,
Berkeley,
Berrien,
Bertie,
Bibb,
Bladen,
Bleckley,
Blount,
Botetourt,
Bradford,
Bradley,
Brantley,
Brevard,
Brooks,
Broward,
Brunswick,
Bryan,
Bulloch,
Bullock,
Buncombe,
Burke,
Butler,
Butts,
Cabarrus,
Caldwell,
Calhoun,
Camden,
Campbell,
Candler,
Carroll,
Carteret,
Caswell,
Catawba,
Chambers,
Charleston,
Charlotte,
Charlton,
Chatham,
Chattahoochee,
Chattooga,
Cherokee,
Chesapeake,
Chester,
Chesterfield,
Chickasaw,
Chilton,
Choctaw,
Chowan,
Citrus,
Clarendon,
Clarke,
Clay,
Clayton,
Cleburne,
Cleveland,
Clinch,
Cobb,
Coffee,
Colleton,
Collier,
Colquitt,
Columbia,
Columbus,
Conecuh,
Cook,
Coosa,
Copiah,
Covington,
Coweta,
Craig,
Craven,
Crawford,
Crenshaw,
Crisp,
Cullman,
Cumberland,
Currituck,
Dade,
Dale,
Dallas,
Danville,
Dare,
Darlington,
Davidson,
Davie,
Dawson,
DeKalb,
DeSoto,
Decatur,
Dillon,
Dinwiddie,
Dixie,
Dodge,
Dooly,
Dorchester,
Dougherty,
Douglas,
Downloadable Data,
Duplin,
Durham,
Duval,
Early,
Echols,
Edgecombe,
Edgefield,
Effingham,
Elbert,
Elmore,
Emanuel,
Emporia,
Escambia,
Esri File GeoDatabase 10,
Etowah,
Evans,
FL,
Fairfield,
Fannin,
Fayette,
FileGDB,
Flagler,
Florence,
Florida,
Floyd,
Forrest,
Forsyth,
Franklin,
Fulton,
GA,
Gadsden,
Gaston,
Gates,
Geneva,
George,
Georgetown,
Georgia,
Gilchrist,
Gilmer,
Glades,
Glascock,
Glynn,
Gordon,
Grady,
Granville,
Grayson,
Greene,
Greensville,
Greenville,
Greenwood,
Guilford,
Gulf,
Gwinnett,
HU-2,
HU-2 Region,
HU2_03,
HUC,
Habersham,
Hale,
Halifax,
Hall,
Hamilton,
Hampton,
Hancock,
Haralson,
Hardee,
Harnett,
Harris,
Harrison,
Hart,
Heard,
Henderson,
Hendry,
Henry,
Hernando,
Hertford,
Highlands,
Hillsborough,
Hinds,
Hoke,
Holmes,
Horry,
Houston,
Hyde,
Hydrography,
Hydrologic Unit Code,
Hydrologic Units,
Indian River,
Iredell,
Irwin,
Isle of Wight,
Itawamba,
Jackson,
Jasper,
Jeff Davis,
Jefferson,
Jefferson Davis,
Jenkins,
Johnson,
Johnston,
Jones,
Kemper,
Kershaw,
LA,
Lafayette,
Lake,
Lamar,
Lancaster,
Lanier,
Lauderdale,
Laurens,
Lawrence,
Leake,
Lee,
Lenoir,
Leon,
Levy,
Lexington,
Liberty,
Lincoln,
Long,
Louisiana,
Lowndes,
Lumpkin,
Lunenburg,
MS,
Macon,
Madison,
Manatee,
Marengo,
Marion,
Marlboro,
Marshall,
Martin,
Martinsville,
McCormick,
McDowell,
McDuffie,
McIntosh,
Mecklenburg,
Meriwether,
Miami-Dade,
Miller,
Mississippi,
Mitchell,
Mobile,
Monroe,
Montgomery,
Moore,
Morgan,
Murray,
Muscogee,
NC,
Nash,
Nassau,
National Watershed Boundary Dataset (WBD),
National Watershed Boundary Dataset (WBD),
Neshoba,
New Hanover,
Newberry,
Newton,
North Carolina,
Northampton,
Nottoway,
Noxubee,
Oconee,
Oglethorpe,
Okaloosa,
Okeechobee,
Oktibbeha,
Onslow,
Orange,
Orangeburg,
Osceola,
Palm Beach,
Pamlico,
Pasco,
Pasquotank,
Patrick,
Paulding,
Peach,
Pearl River,
Pender,
Perquimans,
Perry,
Person,
Petersburg,
Pickens,
Pierce,
Pike,
Pinellas,
Pitt,
Pittsylvania,
Polk,
Pontotoc,
Prentiss,
Prince Edward,
Prince George,
Pulaski,
Putnam,
Quitman,
Rabun,
Randolph,
Rankin,
Region,
Richland,
Richmond,
Roanoke,
Robeson,
Rockdale,
Rockingham,
Rowan,
Russell,
Rutherford,
SC,
Salem,
Saluda,
Sampson,
Santa Rosa,
Sarasota,
Schley,
Scotland,
Scott,
Screven,
Seminole,
Shelby,
Simpson,
Smith,
South Carolina,
Southampton,
Spalding,
Spartanburg,
St. Bernard,
St. Clair,
St. Johns,
St. Lucie,
St. Tammany,
Stanly,
Stephens,
Stewart,
Stokes,
Stone,
Sub-basin,
Sub-region,
Subwatershed,
Suffolk,
Sumter,
Surry,
Sussex,
Suwannee,
TN,
Talbot,
Taliaferro,
Talladega,
Tallapoosa,
Tangipahoa,
Tattnall,
Taylor,
Telfair,
Tennessee,
Terrell,
Thomas,
Tift,
Tippah,
Tishomingo,
Toombs,
Towns,
Transylvania,
Treutlen,
Troup,
Turner,
Tuscaloosa,
Twiggs,
Tyrrell,
US,
Union,
United States,
Upson,
VA,
Vance,
Virginia,
Virginia Beach,
Volusia,
WBD,
Wake,
Wakulla,
Walker,
Walthall,
Walton,
Ware,
Warren,
Washington,
Watauga,
Watershed,
Watershed Boundary Dataset,
Wayne,
Webster,
Wheeler,
White,
Whitfield,
Wilcox,
Wilkes,
Wilkinson,
Williamsburg,
Wilson,
Winston,
Worth,
Yadkin,
Yancey,
York,
inlandWaters, Fewer tags
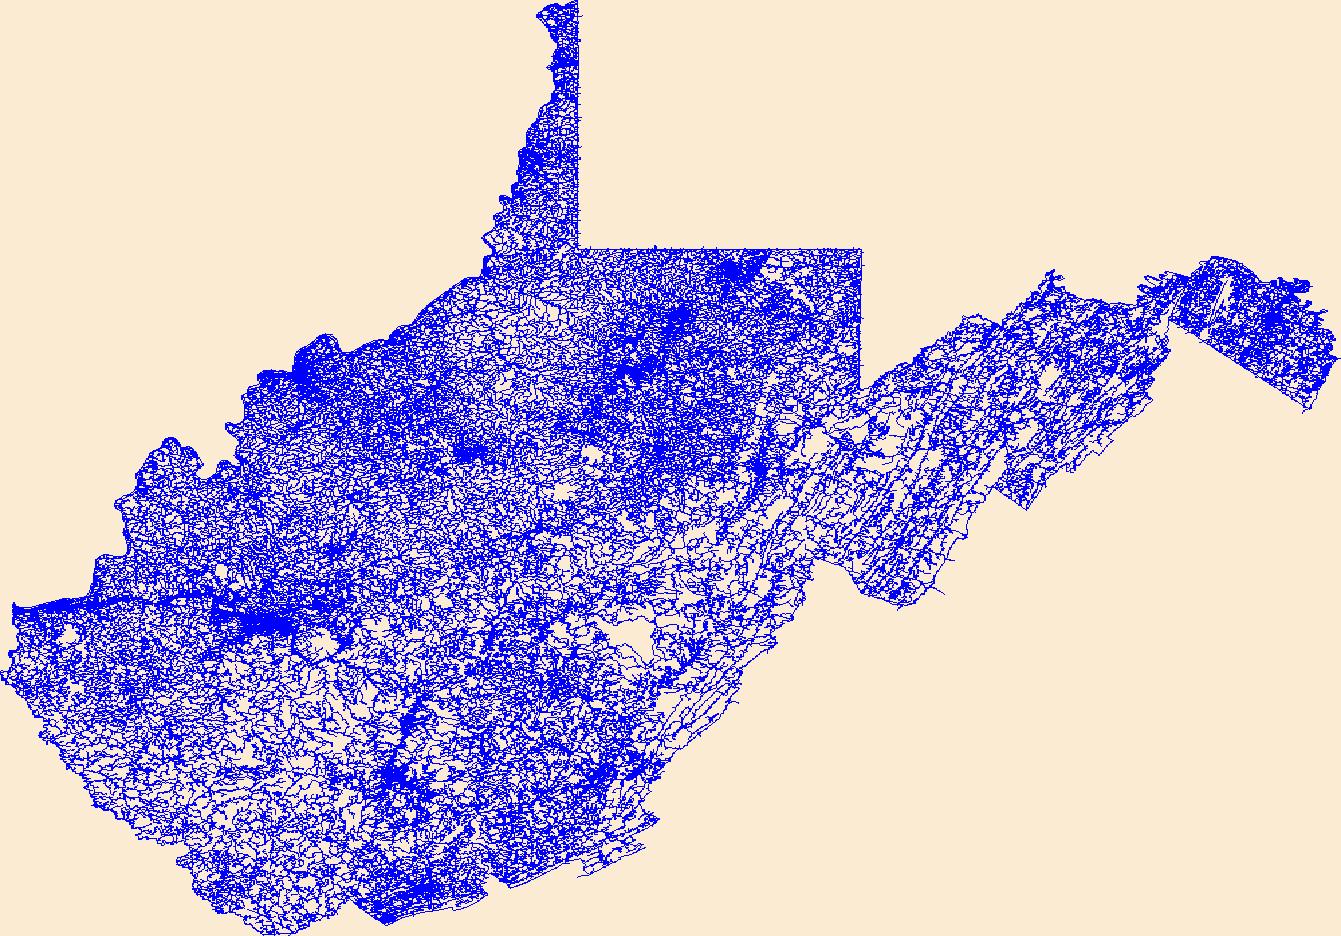
Layers of geospatial data include roads, airports, trails, and railroads.
Tags: Airport Complex,
Airport Point,
Airport Runway,
Airports,
Airstrips, All tags...
Barbour,
Berkeley,
Boone,
Braxton,
Brooke,
Cabell,
Calhoun,
Clay,
Doddridge,
Downloadable Data,
Esri File GeoDatabase 10,
Fayette,
FileGDB,
Geographic names,
Gilmer,
Grant,
Greenbrier,
Hampshire,
Hancock,
Hardy,
Harrison,
Jackson,
Jefferson,
Kanawha,
Lewis,
Lincoln,
Logan,
Marion,
Marshall,
Mason,
McDowell,
Mercer,
Mineral,
Mingo,
Monongalia,
Monroe,
Morgan,
National Transportation Dataset (NTD),
National Transportation Dataset (NTD),
Nicholas,
Ohio,
Pendleton,
Pleasants,
Pocahontas,
Preston,
Putnam,
Railways,
Raleigh,
Randolph,
Ritchie,
Roads,
Roane,
State,
State,
Summers,
Taylor,
Trail,
Trails,
Transportation,
Transportation,
Tucker,
Tyler,
US,
United States,
Upshur,
WV,
Waterway,
Wayne,
Webster,
West Virginia,
Wetzel,
Wirt,
Wood,
Wyoming,
transportation, Fewer tags
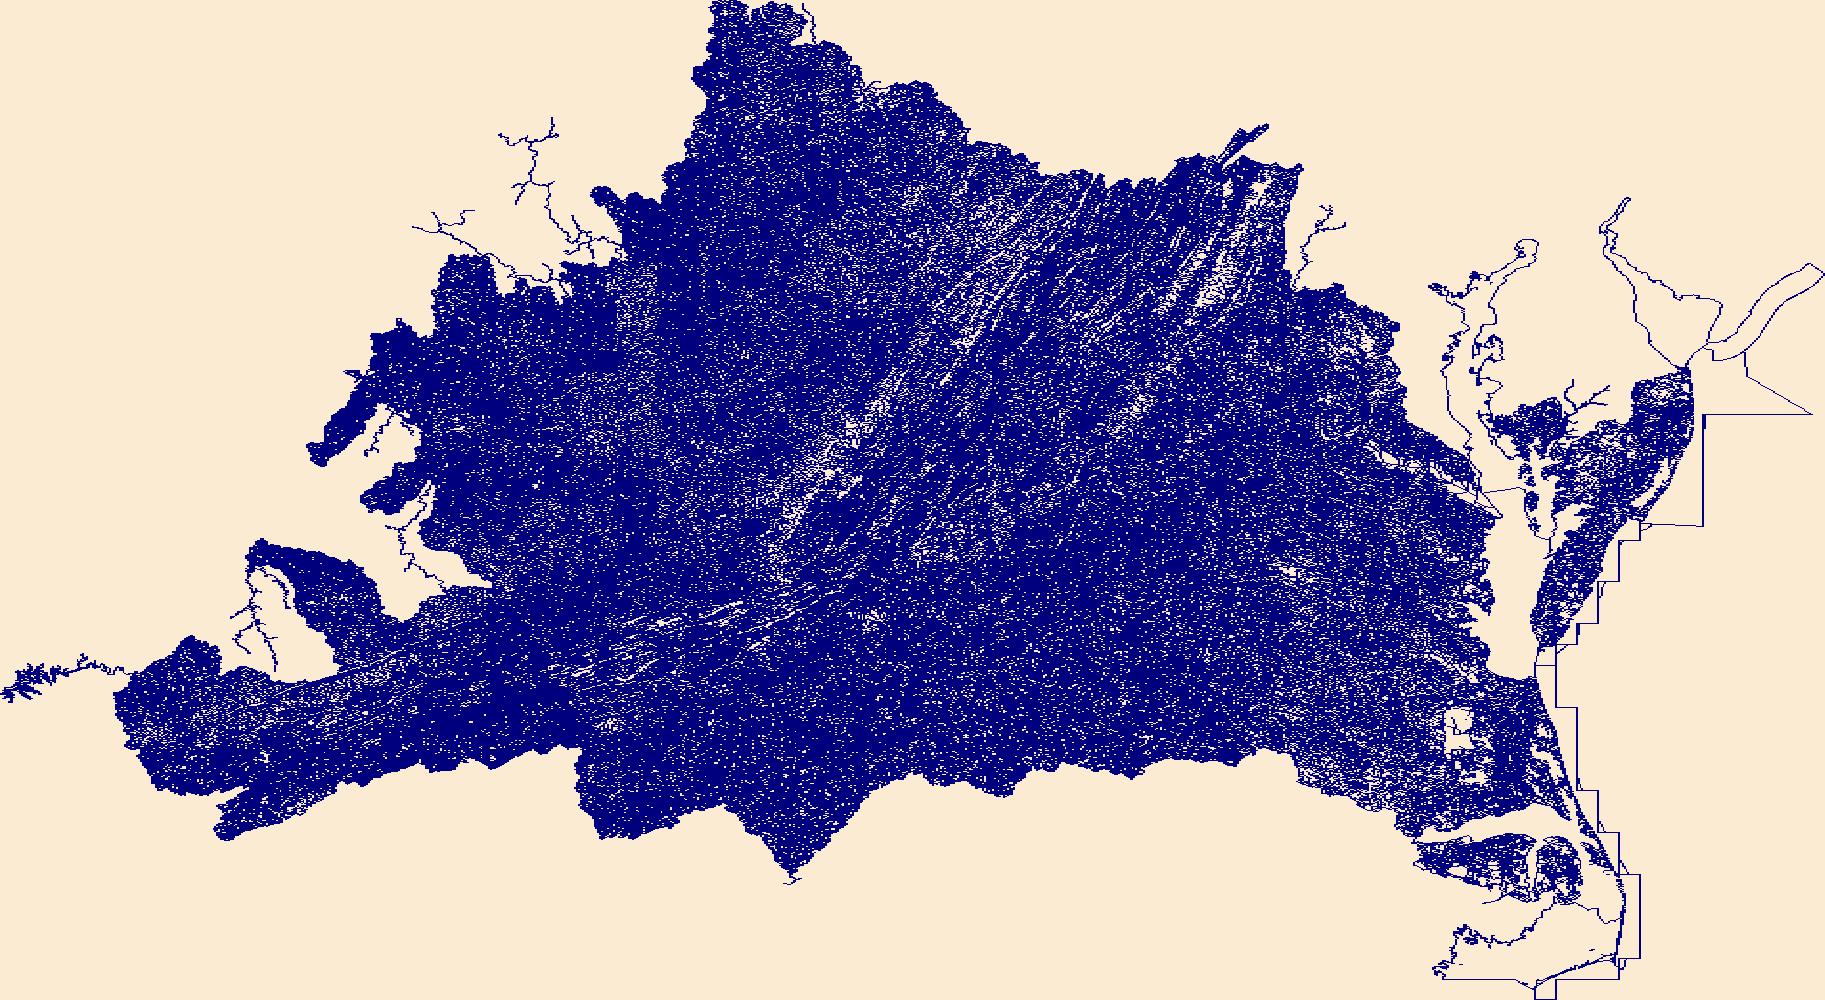
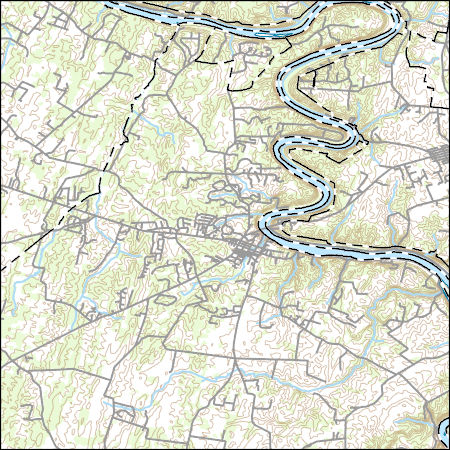
The National Hydrography Dataset (NHD) is a feature-based database that interconnects and uniquely identifies the stream segments or reaches that make up the nation's surface water drainage system. NHD data was originally developed at 1:100,000-scale and exists at that scale for the whole country. This high-resolution NHD, generally developed at 1:24,000/1:12,000 scale, adds detail to the original 1:100,000-scale NHD. (Data for Alaska, Puerto Rico and the Virgin Islands was developed at high-resolution, not 1:100,000 scale.) Local resolution NHD is being developed where partners and data exist. The NHD contains reach codes for networked features, flow direction, names, and centerline representations for areal water...
Tags: Administrative watershed units,
Administrative watershed units,
Area of Complex Channels,
Area to be submerged,
Barbour, All tags...
Basin,
Basin,
Bay/Inlet,
Berkeley,
Boone,
Boundaries,
Boundary,
Braxton,
Bridge,
Brooke,
Cabell,
Calhoun,
Canal/Ditch,
Clay,
Coastline,
Connector,
Dam/Weir,
Doddridge,
Downloadable Data,
Drainage areas for surface water,
Drainageway,
Estuary,
Fayette,
Flow direction network,
Flume,
ForeShore,
Gaging Station,
Gate,
GeoPackage,
Gilmer,
Grant,
Greenbrier,
HU10,
HU12,
HU14,
HU16,
HU2,
HU4,
HU6,
HU8,
HUC,
Hampshire,
Hancock,
Hardy,
Harrison,
Hazard Zone,
Hydrographic,
Hydrography,
Hydrography,
Hydrography,
Hydrologic Unit Code,
Hydrologic Units,
Ice mass,
Inundation Area,
Jackson,
Jefferson,
Kanawha,
Levee,
Lewis,
Lincoln,
Line,
Lock Chamber,
Logan,
Marion,
Marsh,
Marshall,
Mason,
McDowell,
Mercer,
Mineral,
Mingo,
Monongalia,
Monroe,
Morgan,
National Hydrography Dataset (NHD),
National Hydrography Dataset (NHD) Best Resolution,
National Hydrography Dataset (NHD) Best Resolution,
Nicholas,
Nonearthen Shore,
Ohio,
Open Geospatial Consortium GeoPackage 1.2,
Orthoimage,
Pendleton,
Playa,
Pleasants,
Pocahontas,
Point,
PointEvent,
Pond,
Preston,
Putnam,
Raleigh,
Randolph,
Rapids,
Rapids,
Reach,
Reach code,
Reef,
Region,
Reservoir,
Ritchie,
Roane,
Rock,
Sea/Ocean,
Sink/Rise,
Sounding Datum Line,
Special Use Zone,
Special Use Zone Limit,
Spillway,
State,
State,
State_West Virginia,
Stream,
Stream/River,
Sub-basin,
Sub-region,
Subbasin,
Submerged Stream,
Subregion,
Subwatershed,
Summers,
Surface water systems,
Swamp,
Taylor,
Topographic,
Tucker,
Tunnel,
Tyler,
US,
Underground Conduit,
United States,
Upshur,
WBD,
WBD,
WV,
Wall,
Wash,
Water Intake Outflow,
Waterfall,
Watershed,
Watershed Boundaries,
Watershed Boundary Dataset,
Watershed Boundary Dataset,
Wayne,
Webster,
Well,
West Virginia,
Wetzel,
Wirt,
Wood,
Wyoming,
artificial path,
boundaries,
dams,
drainage systems and characteristics,
inlandWaters,
lakes,
ngda,
rivers, Fewer tags
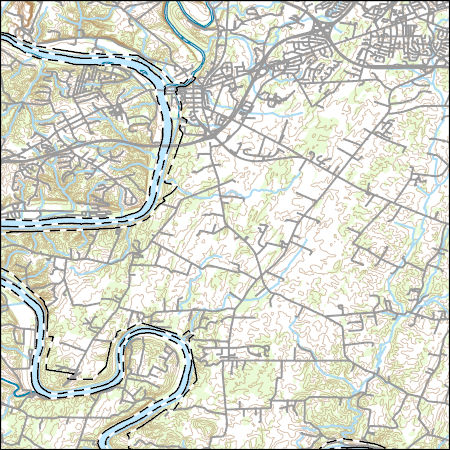
Layers of geospatial data include contours, boundaries, land cover, hydrography, roads, transportation, geographic names, structures, and other selected map features.
Tags: 7.5 x 7.5 minute,
7_5_Min,
Berkeley,
Combined Vector,
Combined Vector, All tags...
Combined Vector,
Downloadable Data,
GeoPackage,
MD,
Maryland,
Open Geospatial Consortium GeoPackage 1.2,
Public Land Survey System,
Topo Map Vector Data,
US,
United States,
WV,
Washington,
West Virginia,
boundary,
contours,
geographic names,
hydrography,
structures,
transportation,
woodland, Fewer tags
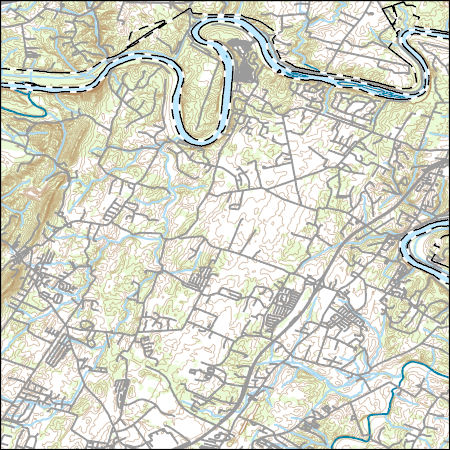
Layers of geospatial data include contours, boundaries, land cover, hydrography, roads, transportation, geographic names, structures, and other selected map features.
Types: Citation;
Tags: 7.5 x 7.5 minute,
7_5_Min,
Berkeley,
Combined Vector,
Combined Vector, All tags...
Combined Vector,
Downloadable Data,
Esri Shapefile nan,
MD,
Maryland,
Public Land Survey System,
Shapefile,
Topo Map Vector Data,
US,
United States,
WV,
Washington,
West Virginia,
boundary,
contours,
geographic names,
hydrography,
structures,
transportation,
woodland, Fewer tags

Layers of geospatial data include contours, boundaries, land cover, hydrography, roads, transportation, geographic names, structures, and other selected map features.
Types: Citation;
Tags: 7.5 x 7.5 minute,
7_5_Min,
Berkeley,
Combined Vector,
Combined Vector, All tags...
Combined Vector,
Downloadable Data,
Esri Shapefile nan,
Jefferson,
MD,
Maryland,
Public Land Survey System,
Shapefile,
Topo Map Vector Data,
US,
United States,
WV,
Washington,
West Virginia,
boundary,
contours,
geographic names,
hydrography,
structures,
transportation,
woodland, Fewer tags
Layers of geospatial data include contours, boundaries, land cover, hydrography, roads, transportation, geographic names, structures, and other selected map features.
Tags: 7.5 x 7.5 minute,
7_5_Min,
Berkeley,
Combined Vector,
Combined Vector, All tags...
Combined Vector,
Downloadable Data,
GeoPackage,
Open Geospatial Consortium GeoPackage 1.2,
Public Land Survey System,
Topo Map Vector Data,
US,
United States,
WV,
West Virginia,
boundary,
contours,
geographic names,
hydrography,
structures,
transportation,
woodland, Fewer tags
Layers of geospatial data include contours, boundaries, land cover, hydrography, roads, transportation, geographic names, structures, and other selected map features.
Tags: 7.5 x 7.5 minute,
7_5_Min,
Berkeley,
Combined Vector,
Combined Vector, All tags...
Combined Vector,
Downloadable Data,
GeoPackage,
Jefferson,
MD,
Maryland,
Open Geospatial Consortium GeoPackage 1.2,
Public Land Survey System,
Topo Map Vector Data,
US,
United States,
WV,
Washington,
West Virginia,
boundary,
contours,
geographic names,
hydrography,
structures,
transportation,
woodland, Fewer tags
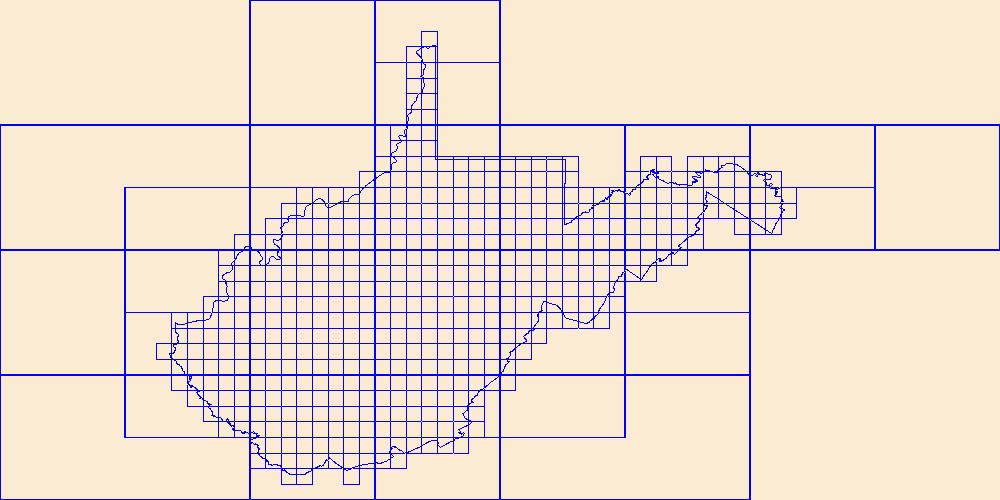
This data represents the map extent for current and historical USGS topographic maps for the United States and Territories, including 1 X 2 Degree, 1 X 1 Degree, 30 X 60 Minute, 15 X 15 Minute, 7.5 X 7.5 Minute, and 3.75 X 3.75 Minute. The grid was generated using ESRI ArcInfo GIS software.
Types: Citation;
Tags: Barbour,
Berkeley,
Boone,
Boundaries,
Braxton, All tags...
Brooke,
Cabell,
Calhoun,
Clay,
Doddridge,
Downloadable Data,
Esri Shapefile nan,
Fayette,
Gilmer,
Grant,
Greenbrier,
Hampshire,
Hancock,
Hardy,
Harrison,
Jackson,
Jefferson,
Kanawha,
Lewis,
Lincoln,
Logan,
Map Indices,
Map Indices,
Map Indices,
Marion,
Marshall,
Mason,
McDowell,
Mercer,
Mineral,
Mingo,
Monongalia,
Monroe,
Morgan,
Nicholas,
Ohio,
Pendleton,
Pleasants,
Pocahontas,
Preston,
Putnam,
Raleigh,
Randolph,
Ritchie,
Roane,
Shapefile,
State,
State,
Summers,
Taylor,
Tucker,
Tyler,
US,
United States,
United States of America,
Upshur,
WV,
Wayne,
Webster,
West Virginia,
Wetzel,
Wirt,
Wood,
Wyoming,
cells,
map indices,
polygon grid, Fewer tags
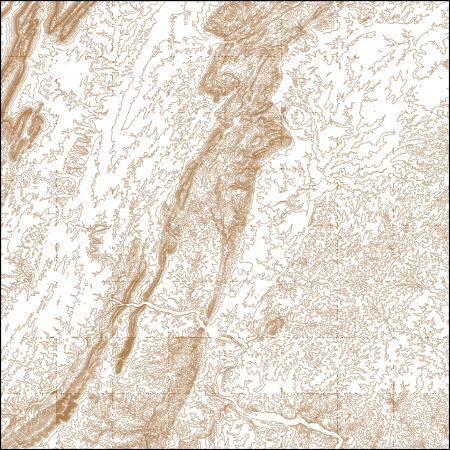
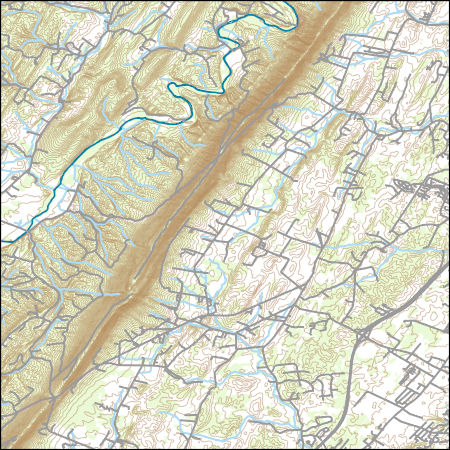
These vector contour lines are derived from the 3D Elevation Program using automated and semi-automated processes. They were created to support 1:24,000-scale CONUS and Hawaii, 1:25,000-scale Alaska, and 1:20,000-scale Puerto Rico / US Virgin Island topographic map products, but are also published in this GIS vector format. Contour intervals are assigned by 7.5-minute quadrangle, so this vector dataset is not visually seamless across quadrangle boundaries. The vector lines have elevation attributes (in feet above mean sea level on NAVD88), but this dataset does not carry line symbols or annotation.
Tags: 1 x 1 degree,
1X1,
Adams,
Berkeley,
Carroll, All tags...
Clarke,
Cumberland,
Downloadable Data,
Elevation,
Elevation Terrestrial,
Fairfax,
Fauquier,
Franklin,
Frederick,
Fulton,
GeoPackage,
Howard,
Jefferson,
Loudoun,
MD,
Maryland,
Montgomery,
National Elevation Dataset (NED),
National Elevation Dataset (NED) 1/3 arc-second - Contours,
National Elevation Dataset (NED) 1/3 arc-second - Contours,
Open Geospatial Consortium GeoPackage 1.2,
PA,
Pennsylvania,
US,
United States,
VA,
Virginia,
WV,
Washington,
West Virginia,
York,
elevation,
ngda, Fewer tags
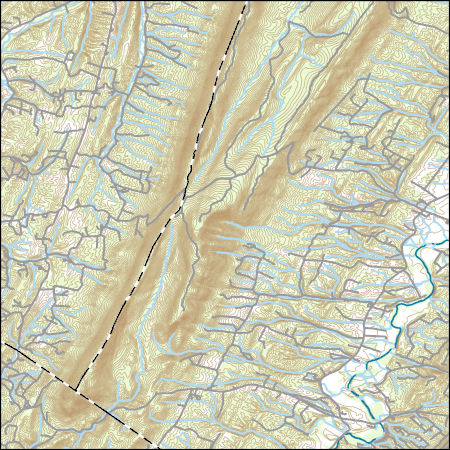
Layers of geospatial data include contours, boundaries, land cover, hydrography, roads, transportation, geographic names, structures, and other selected map features.
Types: Citation;
Tags: 7.5 x 7.5 minute,
7_5_Min,
Berkeley,
Combined Vector,
Combined Vector, All tags...
Combined Vector,
Downloadable Data,
Esri File GeoDatabase 10,
FileGDB,
Frederick,
Morgan,
Public Land Survey System,
Topo Map Vector Data,
US,
United States,
VA,
Virginia,
WV,
West Virginia,
boundary,
contours,
geographic names,
hydrography,
structures,
transportation,
woodland, Fewer tags

The National Hydrography Dataset (NHD) is a feature-based database that interconnects and uniquely identifies the stream segments or reaches that make up the nation's surface water drainage system. NHD data was originally developed at 1:100,000-scale and exists at that scale for the whole country. This high-resolution NHD, generally developed at 1:24,000/1:12,000 scale, adds detail to the original 1:100,000-scale NHD. (Data for Alaska, Puerto Rico and the Virgin Islands was developed at high-resolution, not 1:100,000 scale.) Local resolution NHD is being developed where partners and data exist. The NHD contains reach codes for networked features, flow direction, names, and centerline representations for areal water...
Tags: Administrative watershed units,
Administrative watershed units,
Area of Complex Channels,
Area to be submerged,
Basin, All tags...
Basin,
Bay/Inlet,
Berkeley,
Boundaries,
Boundary,
Bridge,
Canal/Ditch,
Charleston,
Coastline,
Connector,
Dam/Weir,
Downloadable Data,
Drainage areas for surface water,
Drainageway,
Estuary,
Flow direction network,
Flume,
ForeShore,
Gaging Station,
Gate,
GeoPackage,
Georgetown,
HU-8,
HU-8 Subbasin,
HU10,
HU12,
HU14,
HU16,
HU2,
HU4,
HU6,
HU8,
HU8_03050209,
HUC,
Hazard Zone,
Hydrographic,
Hydrography,
Hydrography,
Hydrography,
Hydrologic Unit Code,
Hydrologic Units,
Ice mass,
Inundation Area,
Levee,
Line,
Lock Chamber,
Marsh,
National Hydrography Dataset (NHD),
National Hydrography Dataset (NHD) Best Resolution,
National Hydrography Dataset (NHD) Best Resolution,
Nonearthen Shore,
Open Geospatial Consortium GeoPackage 1.2,
Orthoimage,
Playa,
Point,
PointEvent,
Pond,
Rapids,
Rapids,
Reach,
Reach code,
Reef,
Region,
Reservoir,
Rock,
SC,
Sea/Ocean,
Sink/Rise,
Sounding Datum Line,
South Carolina,
Special Use Zone,
Special Use Zone Limit,
Spillway,
Stream,
Stream/River,
Sub-basin,
Sub-region,
Subbasin,
Submerged Stream,
Subregion,
Subwatershed,
Surface water systems,
Swamp,
Topographic,
Tunnel,
US,
Underground Conduit,
United States,
WBD,
WBD,
Wall,
Wash,
Water Intake Outflow,
Waterfall,
Watershed,
Watershed Boundaries,
Watershed Boundary Dataset,
Watershed Boundary Dataset,
Well,
artificial path,
boundaries,
dams,
drainage systems and characteristics,
inlandWaters,
lakes,
ngda,
rivers, Fewer tags
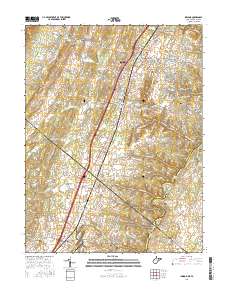
Layered geospatial PDF Map. Layers of geospatial data include orthoimagery, roads, grids, geographic names, elevation contours, hydrography, and other selected map features.
Tags: 7.5 x 7.5 minute,
Berkeley,
Clarke,
Downloadable Data,
EarthCover, All tags...
Frederick,
GeoPDF,
Imagery and Base Maps,
Inwood, WV-VA,
Jefferson,
Map,
Public Land Survey System,
U.S. National Grid,
US,
US Topo,
US Topo Historical,
United States,
Virginia,
West Virginia,
boundary,
contour,
geographic names,
hydrography,
imageryBaseMapsEarthCover,
orthoimage,
structures,
topographic,
transportation,
woodland, Fewer tags
Layered GeoPDF 7.5 Minute Quadrangle Map. Layers of geospatial data include orthoimagery, roads, grids, geographic names, elevation contours, hydrography, and other selected map features.
Tags: 7.5 x 7.5 minute,
Berkeley,
Butlers Bay, SC,
Clarendon,
Downloadable Data, All tags...
EarthCover,
GeoPDF,
Imagery and Base Maps,
Map,
Public Land Survey System,
South Carolina,
U.S. National Grid,
US,
US Topo,
US Topo Historical,
United States,
Williamsburg,
boundary,
contour,
geographic names,
hydrography,
imageryBaseMapsEarthCover,
orthoimage,
structures,
topographic,
transportation,
woodland, Fewer tags
Layered geospatial PDF Map. Layers of geospatial data include orthoimagery, roads, grids, geographic names, elevation contours, hydrography, and other selected map features.
Tags: 7.5 x 7.5 minute,
Berkeley,
Blakely, SC,
Downloadable Data,
EarthCover, All tags...
GeoPDF,
Imagery and Base Maps,
Map,
Public Land Survey System,
South Carolina,
U.S. National Grid,
US,
US Topo,
US Topo Historical,
United States,
Williamsburg,
boundary,
contour,
geographic names,
hydrography,
imageryBaseMapsEarthCover,
orthoimage,
structures,
topographic,
transportation,
woodland, Fewer tags
Layered GeoPDF 7.5 Minute Quadrangle Map. Layers of geospatial data include orthoimagery, roads, grids, geographic names, elevation contours, hydrography, and other selected map features.
Tags: 7.5 x 7.5 minute,
Berkeley,
Downloadable Data,
EarthCover,
GeoPDF, All tags...
Imagery and Base Maps,
Map,
Moncks Corner, SC,
South Carolina,
U.S. National Grid,
US,
US Topo,
US Topo Historical,
United States,
contour,
geographic names,
hydrography,
imageryBaseMapsEarthCover,
orthoimage,
structures,
topographic,
transportation, Fewer tags
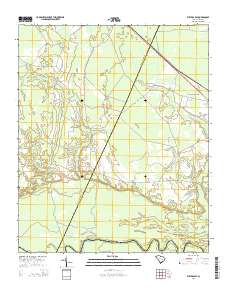
Layered GeoPDF 7.5 Minute Quadrangle Map. Layers of geospatial data include orthoimagery, roads, grids, geographic names, elevation contours, hydrography, and other selected map features.
Tags: 7.5 x 7.5 minute,
Berkeley,
Charleston,
Downloadable Data,
EarthCover, All tags...
GeoPDF,
Imagery and Base Maps,
Map,
Mount Holly, SC,
South Carolina,
U.S. National Grid,
US,
US Topo,
US Topo Historical,
United States,
contour,
geographic names,
hydrography,
imageryBaseMapsEarthCover,
orthoimage,
structures,
topographic,
transportation, Fewer tags
Layered GeoPDF 7.5 Minute Quadrangle Map. Layers of geospatial data include orthoimagery, roads, grids, geographic names, elevation contours, hydrography, and other selected map features.
Tags: 7.5 x 7.5 minute,
Berkeley,
Charleston,
Downloadable Data,
EarthCover, All tags...
GeoPDF,
Imagery and Base Maps,
Map,
Sewee Bay, SC,
South Carolina,
U.S. National Grid,
US,
US Topo,
US Topo Historical,
United States,
contour,
geographic names,
hydrography,
imageryBaseMapsEarthCover,
orthoimage,
structures,
topographic,
transportation, Fewer tags
Layered geospatial PDF Map. Layers of geospatial data include orthoimagery, roads, grids, geographic names, elevation contours, hydrography, and other selected map features.
Tags: 7.5 x 7.5 minute,
Berkeley,
Charleston,
Downloadable Data,
EarthCover, All tags...
GeoPDF,
Imagery and Base Maps,
Map,
Public Land Survey System,
Shulerville, SC,
South Carolina,
U.S. National Grid,
US,
US Topo,
US Topo Historical,
United States,
boundary,
contour,
geographic names,
hydrography,
imageryBaseMapsEarthCover,
orthoimage,
structures,
topographic,
transportation,
woodland, Fewer tags
Layered geospatial PDF Map. Layers of geospatial data include orthoimagery, roads, grids, geographic names, elevation contours, hydrography, and other selected map features.
Tags: 7.5 x 7.5 minute,
Berkeley,
Charleston,
Downloadable Data,
EarthCover, All tags...
GeoPDF,
Georgetown,
Imagery and Base Maps,
Map,
Public Land Survey System,
South Carolina,
South Santee, SC,
U.S. National Grid,
US,
US Topo,
US Topo Historical,
United States,
boundary,
contour,
geographic names,
hydrography,
imageryBaseMapsEarthCover,
orthoimage,
structures,
topographic,
transportation,
woodland, Fewer tags
|
|

