Filters: Tags: Bradford County (X)
109 results (74ms)|
Filters
Date Range
Extensions Types
Contacts
Categories Tag Types Tag Schemes |
Groundwater quality data for 472 domestic well-water samples were retrieved from the USGS National Water Information System (NWIS) database and combined with descriptive information on the sampled well locations. The NWIS data for a sample, collected on the selected date, were averaged into a single record (one per well), and rounded according to USGS protocols. For evaluation and reporting, the water-quality data were further combined with physical attributes and classified by lithology, topographic position, physiographic province, region, redox, and pH (as standalone matrix, one row per well). A second data matrix file incorporating minimum reporting levels for censored and low-reported values (set to 0.99X highest...
Categories: Data;
Tags: Bradford County,
Clinton County,
Geochemistry,
Groundwater Quality,
Hydrology,
A table summarizing the inventoried acreage by crop type and irrigation system was compiled for Bradford County, Florida. The irrigated acreage totals were derived from analyses of satellite and aerial imagery. Crop types and irrigation system types were verified during field trips that started in January 2020 and concluded in December 2020. In addition, the table provides acreage totals by crop type reported by the U.S. Department of Commerce for 1982, the U.S. Department of Agriculture from 1987 through 2017, and Florida Statewide Agricultural Irrigation Demand for 2016-18.
Categories: Data;
Tags: Bradford County,
Crop type,
Florida,
Florida Department of Agriculture and Consumer Services,
Groundwater,
Layered geospatial PDF 7.5 Minute Quadrangle Map. Layers of geospatial data include orthoimagery, roads, grids, geographic names, elevation contours, hydrography, and other selected map features. This map is derived from GIS (geospatial information system) data. It represents a repackaging of GIS data in traditional map form, not creation of new information. The geospatial data in this map are from selected National Map data holdings and other government sources.
Layered geospatial PDF 7.5 Minute Quadrangle Map. Layers of geospatial data include orthoimagery, roads, grids, geographic names, elevation contours, hydrography, and other selected map features. This map is derived from GIS (geospatial information system) data. It represents a repackaging of GIS data in traditional map form, not creation of new information. The geospatial data in this map are from selected National Map data holdings and other government sources.
Layered geospatial PDF 7.5 Minute Quadrangle Map. Layers of geospatial data include orthoimagery, roads, grids, geographic names, elevation contours, hydrography, and other selected map features. This map is derived from GIS (geospatial information system) data. It represents a repackaging of GIS data in traditional map form, not creation of new information. The geospatial data in this map are from selected National Map data holdings and other government sources.
Layered geospatial PDF 7.5 Minute Quadrangle Map. Layers of geospatial data include orthoimagery, roads, grids, geographic names, elevation contours, hydrography, and other selected map features. This map is derived from GIS (geospatial information system) data. It represents a repackaging of GIS data in traditional map form, not creation of new information. The geospatial data in this map are from selected National Map data holdings and other government sources.
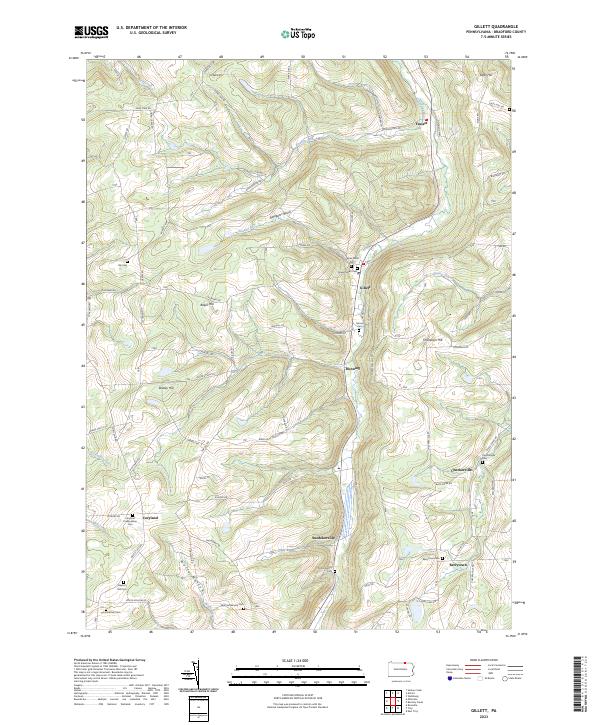
Layered geospatial PDF 7.5 Minute Quadrangle Map. Layers of geospatial data include orthoimagery, roads, grids, geographic names, elevation contours, hydrography, and other selected map features. This map is derived from GIS (geospatial information system) data. It represents a repackaging of GIS data in traditional map form, not creation of new information. The geospatial data in this map are from selected National Map data holdings and other government sources.
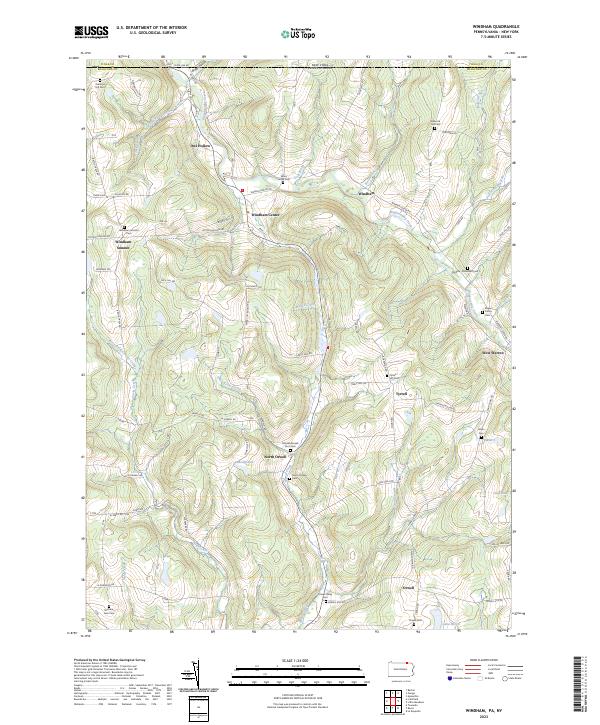
Layered geospatial PDF 7.5 Minute Quadrangle Map. Layers of geospatial data include orthoimagery, roads, grids, geographic names, elevation contours, hydrography, and other selected map features. This map is derived from GIS (geospatial information system) data. It represents a repackaging of GIS data in traditional map form, not creation of new information. The geospatial data in this map are from selected National Map data holdings and other government sources.
Layered geospatial PDF 7.5 Minute Quadrangle Map. Layers of geospatial data include orthoimagery, roads, grids, geographic names, elevation contours, hydrography, and other selected map features. This map is derived from GIS (geospatial information system) data. It represents a repackaging of GIS data in traditional map form, not creation of new information. The geospatial data in this map are from selected National Map data holdings and other government sources.
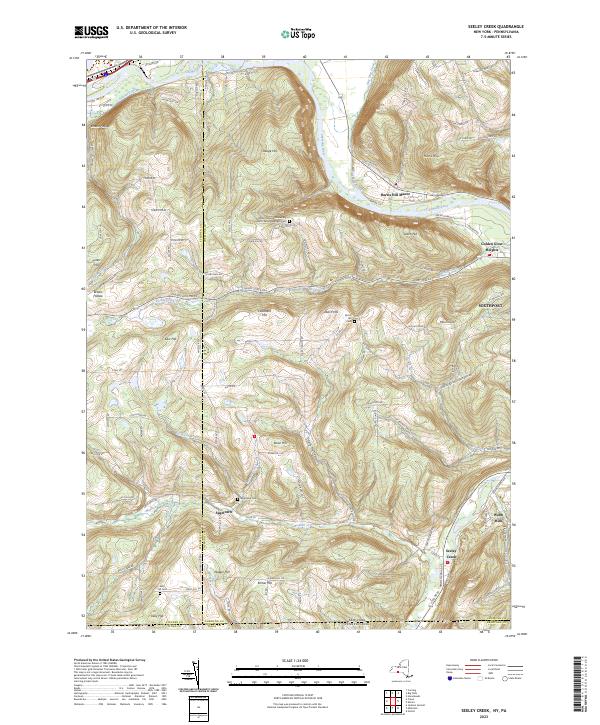
Layered geospatial PDF 7.5 Minute Quadrangle Map. Layers of geospatial data include orthoimagery, roads, grids, geographic names, elevation contours, hydrography, and other selected map features. This map is derived from GIS (geospatial information system) data. It represents a repackaging of GIS data in traditional map form, not creation of new information. The geospatial data in this map are from selected National Map data holdings and other government sources.
To accurately estimate agricultural water use or to project future water demands, a detailed inventory of current irrigated crop acreage is needed at a high level of resolution. In many Florida counties this kind of detailed high-resolution inventory is not available. A detailed digital map and summary of irrigated acreage during the 2015 growing season was developed for 13 of the 15 counties that compose the Suwannee River Water Management District. The irrigated areas were delineated using land-use data, orthoimagery, water management district consumptive water-use permits, and digitized agricultural landuse maps developed by the Florida Department of Agriculture and Consumer Services, Florida Statewide Agricultural...
Categories: Data;
Types: Citation;
Tags: Alachua County,
Bradford County,
Columbia County,
Crop type,
Dixie County,
Layered geospatial PDF 7.5 Minute Quadrangle Map. Layers of geospatial data include orthoimagery, roads, grids, geographic names, elevation contours, hydrography, and other selected map features. This map is derived from GIS (geospatial information system) data. It represents a repackaging of GIS data in traditional map form, not creation of new information. The geospatial data in this map are from selected National Map data holdings and other government sources.
Layered geospatial PDF 7.5 Minute Quadrangle Map. Layers of geospatial data include orthoimagery, roads, grids, geographic names, elevation contours, hydrography, and other selected map features. This map is derived from GIS (geospatial information system) data. It represents a repackaging of GIS data in traditional map form, not creation of new information. The geospatial data in this map are from selected National Map data holdings and other government sources.
This dataset contains quality-assurance and quality-control data (QA/QC) not publicly available in the online National Water Information System (NWIS) for the Pennsylvania Groundwater Monitoring Network collected by the U.S. Geological Survey (USGS) in Pennsylvania, 2015-2019. The quality-control data (such as blanks and replicates) were collected at a subset of sites to ensure that the data meets specific data-quality objectives of this program. Also included in this data release are the supplemental tables for the accompanying USGS publication “Characterization of Ambient Groundwater Quality within a State-wide, Fixed Station Monitoring Network in Pennsylvania, 2015-2019.” The supplemental tables consist of: 1)...
Categories: Data;
Tags: Adams County,
Bradford County,
Carbon County,
Centre County,
Chester County,
This dataset contains the lithologic class and topographic position index information and quality-assurance and quality-control data not available in the online National Water Information System for 72 domestic wells sampled by the U.S. Geological Survey in Bradford County, Pennsylvania, May-August 2016. The topographic position index (TPI) for each well location was computed on the basis of a 25-meter digital elevation model (U.S. Geological Survey, 2009) using criteria reported by Llewellyn (2014) to indicate potential classes for topographic setting. The bedrock geologic unit and primary lithology were determined for each well location on the basis of the digital bedrock geologic map of Pennsylvania (Miles and...
Layered geospatial PDF 7.5 Minute Quadrangle Map. Layers of geospatial data include orthoimagery, roads, grids, geographic names, elevation contours, hydrography, and other selected map features. This map is derived from GIS (geospatial information system) data. It represents a repackaging of GIS data in traditional map form, not creation of new information. The geospatial data in this map are from selected National Map data holdings and other government sources.
Layered geospatial PDF 7.5 Minute Quadrangle Map. Layers of geospatial data include orthoimagery, roads, grids, geographic names, elevation contours, hydrography, and other selected map features. This map is derived from GIS (geospatial information system) data. It represents a repackaging of GIS data in traditional map form, not creation of new information. The geospatial data in this map are from selected National Map data holdings and other government sources.
Layered geospatial PDF 7.5 Minute Quadrangle Map. Layers of geospatial data include orthoimagery, roads, grids, geographic names, elevation contours, hydrography, and other selected map features. This map is derived from GIS (geospatial information system) data. It represents a repackaging of GIS data in traditional map form, not creation of new information. The geospatial data in this map are from selected National Map data holdings and other government sources.
To accurately estimate agricultural water use or to project future water demands, a detailed inventory of current irrigated crop acreage is needed at a high level of resolution. In many Florida counties this kind of detailed high-resolution inventory is not available. A detailed digital map and summary of irrigated acreage during the 2015 growing season was developed for 13 of the 15 counties that compose the Suwannee River Water Management District. The irrigated areas were delineated using land-use data, orthoimagery, water management district consumptive water-use permits, and digitized agricultural landuse maps developed by the Florida Department of Agriculture and Consumer Services, Florida Statewide Agricultural...
Layered geospatial PDF 7.5 Minute Quadrangle Map. Layers of geospatial data include orthoimagery, roads, grids, geographic names, elevation contours, hydrography, and other selected map features. This map is derived from GIS (geospatial information system) data. It represents a repackaging of GIS data in traditional map form, not creation of new information. The geospatial data in this map are from selected National Map data holdings and other government sources.
|

|
