Filters: Tags: Delaware County (X)
460 results (192ms)|
Filters
Date Range
Extensions Types Contacts
Categories Tag Types
|
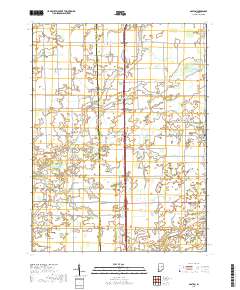
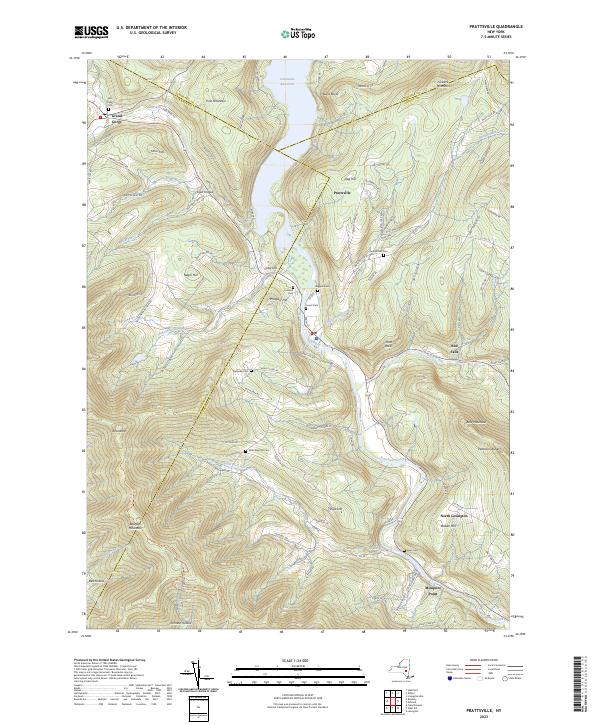
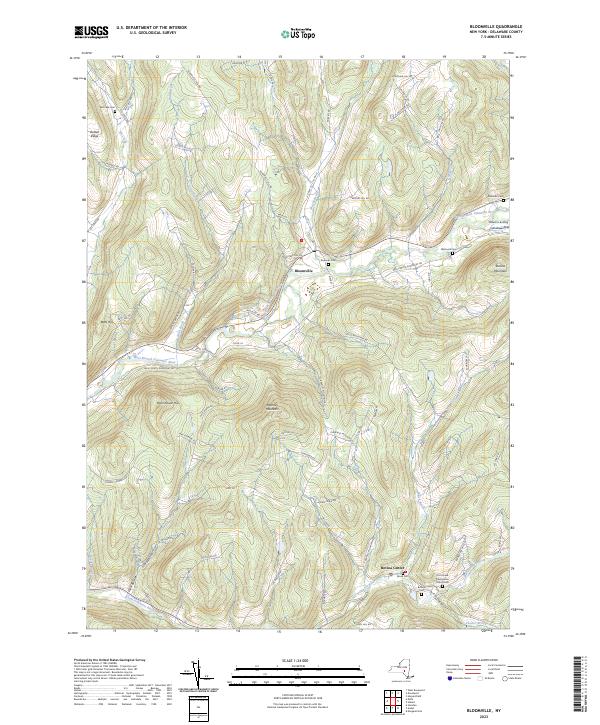
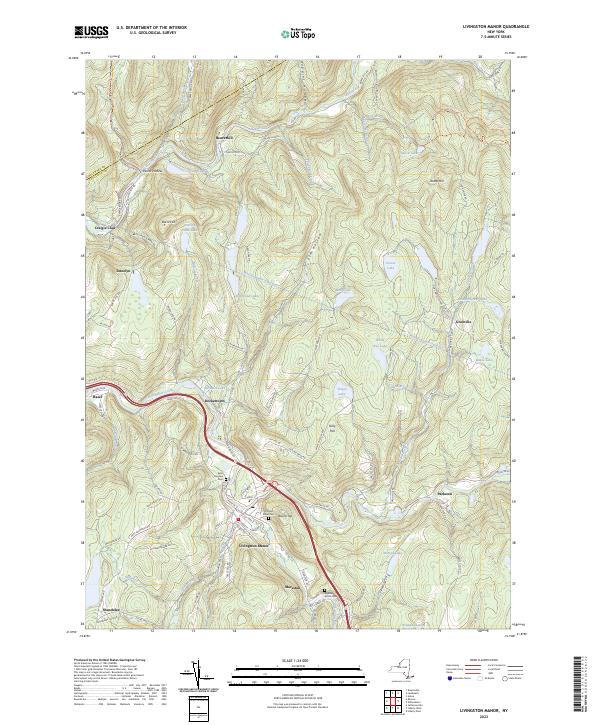
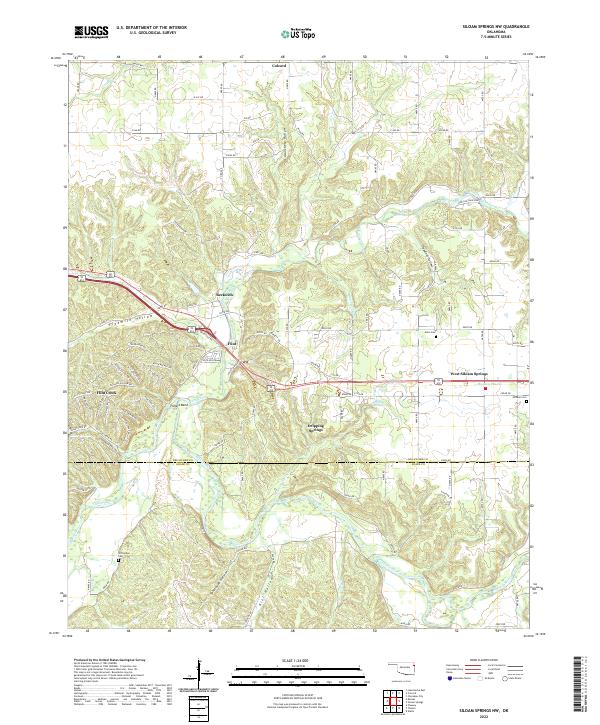
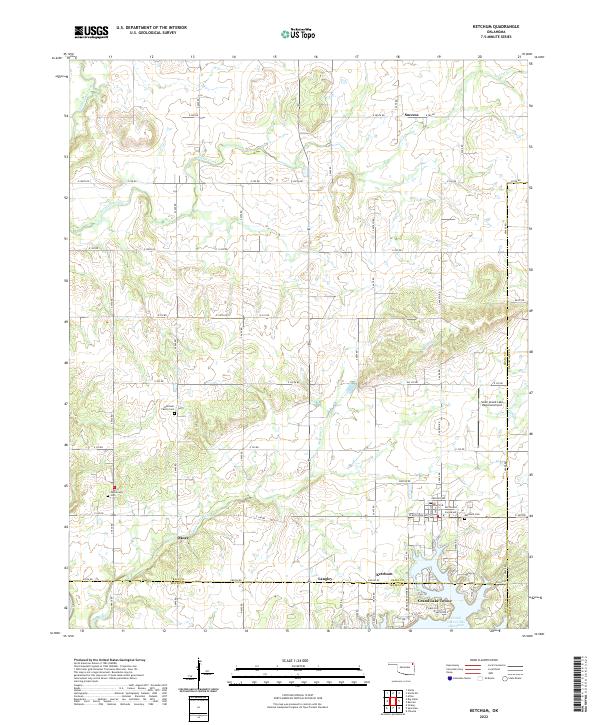
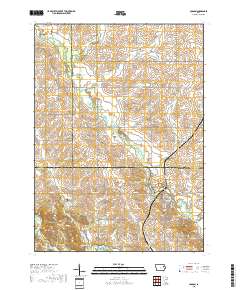
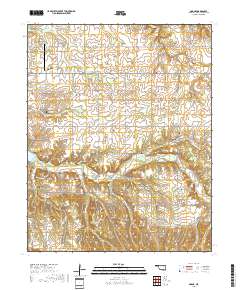
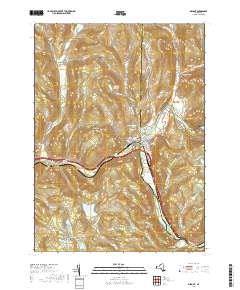
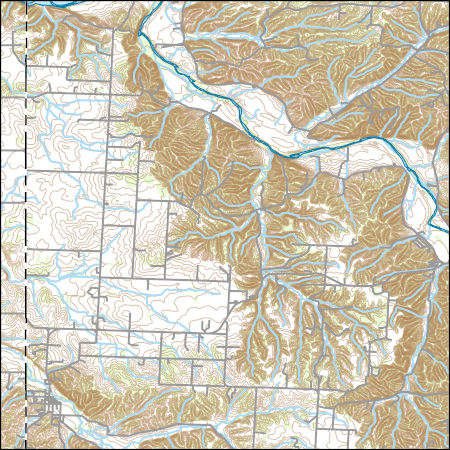
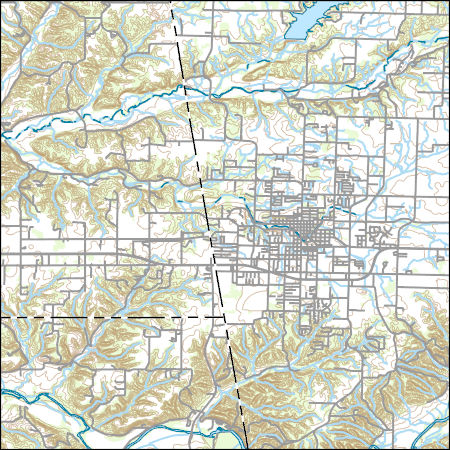
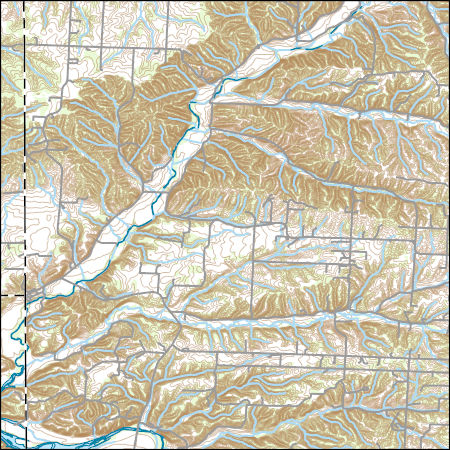
Layered geospatial PDF 7.5 Minute Quadrangle Map. Layers of geospatial data include orthoimagery, roads, grids, geographic names, elevation contours, hydrography, and other selected map features. This map is derived from GIS (geospatial information system) data. It represents a repackaging of GIS data in traditional map form, not creation of new information. The geospatial data in this map are from selected National Map data holdings and other government sources.
Layered geospatial PDF 7.5 Minute Quadrangle Map. Layers of geospatial data include orthoimagery, roads, grids, geographic names, elevation contours, hydrography, and other selected map features. This map is derived from GIS (geospatial information system) data. It represents a repackaging of GIS data in traditional map form, not creation of new information. The geospatial data in this map are from selected National Map data holdings and other government sources.
Layered geospatial PDF 7.5 Minute Quadrangle Map. Layers of geospatial data include orthoimagery, roads, grids, geographic names, elevation contours, hydrography, and other selected map features. This map is derived from GIS (geospatial information system) data. It represents a repackaging of GIS data in traditional map form, not creation of new information. The geospatial data in this map are from selected National Map data holdings and other government sources.
Layered geospatial PDF 7.5 Minute Quadrangle Map. Layers of geospatial data include orthoimagery, roads, grids, geographic names, elevation contours, hydrography, and other selected map features. This map is derived from GIS (geospatial information system) data. It represents a repackaging of GIS data in traditional map form, not creation of new information. The geospatial data in this map are from selected National Map data holdings and other government sources.
Layered geospatial PDF 7.5 Minute Quadrangle Map. Layers of geospatial data include orthoimagery, roads, grids, geographic names, elevation contours, hydrography, and other selected map features. This map is derived from GIS (geospatial information system) data. It represents a repackaging of GIS data in traditional map form, not creation of new information. The geospatial data in this map are from selected National Map data holdings and other government sources.
Layered geospatial PDF 7.5 Minute Quadrangle Map. Layers of geospatial data include orthoimagery, roads, grids, geographic names, elevation contours, hydrography, and other selected map features. This map is derived from GIS (geospatial information system) data. It represents a repackaging of GIS data in traditional map form, not creation of new information. The geospatial data in this map are from selected National Map data holdings and other government sources.
Layered geospatial PDF 7.5 Minute Quadrangle Map. Layers of geospatial data include orthoimagery, roads, grids, geographic names, elevation contours, hydrography, and other selected map features. This map is derived from GIS (geospatial information system) data. It represents a repackaging of GIS data in traditional map form, not creation of new information. The geospatial data in this map are from selected National Map data holdings and other government sources.
Layered geospatial PDF 7.5 Minute Quadrangle Map. Layers of geospatial data include orthoimagery, roads, grids, geographic names, elevation contours, hydrography, and other selected map features. This map is derived from GIS (geospatial information system) data. It represents a repackaging of GIS data in traditional map form, not creation of new information. The geospatial data in this map are from selected National Map data holdings and other government sources.
Layered geospatial PDF 7.5 Minute Quadrangle Map. Layers of geospatial data include orthoimagery, roads, grids, geographic names, elevation contours, hydrography, and other selected map features. This map is derived from GIS (geospatial information system) data. It represents a repackaging of GIS data in traditional map form, not creation of new information. The geospatial data in this map are from selected National Map data holdings and other government sources.
Layered geospatial PDF 7.5 Minute Quadrangle Map. Layers of geospatial data include orthoimagery, roads, grids, geographic names, elevation contours, hydrography, and other selected map features. This map is derived from GIS (geospatial information system) data. It represents a repackaging of GIS data in traditional map form, not creation of new information. The geospatial data in this map are from selected National Map data holdings and other government sources.
Layered geospatial PDF 7.5 Minute Quadrangle Map. Layers of geospatial data include orthoimagery, roads, grids, geographic names, elevation contours, hydrography, and other selected map features. This map is derived from GIS (geospatial information system) data. It represents a repackaging of GIS data in traditional map form, not creation of new information. The geospatial data in this map are from selected National Map data holdings and other government sources.
Layered geospatial PDF 7.5 Minute Quadrangle Map. Layers of geospatial data include orthoimagery, roads, grids, geographic names, elevation contours, hydrography, and other selected map features. This map is derived from GIS (geospatial information system) data. It represents a repackaging of GIS data in traditional map form, not creation of new information. The geospatial data in this map are from selected National Map data holdings and other government sources.
From 2013 to 2015, bathymetric surveys of New York City’s six West of Hudson reservoirs (Ashokan, Cannonsville, Neversink, Pepacton, Rondout, and Schoharie) were performed to provide updated capacity tables and bathymetric maps. Depths were surveyed with a single-beam echo sounder and real-time kinematic global positioning system (RTK-GPS) along planned transects at predetermined intervals for each reservoir. A separate set of echo sounder data was collected along transects at oblique angles to the main transects for accuracy assessment. Field survey data was combined with water-surface elevations in a geographic information system to create three-dimensional surfaces representing reservoir-bed elevations in the...
Categories: Data;
Types: Citation;
Tags: Cannonsville Reservoir,
Delaware County,
GPS measurement,
bathymetry,
single-beam echo sounder
From 2013 to 2015, bathymetric surveys of New York City’s six West of Hudson reservoirs (Ashokan, Cannonsville, Neversink, Pepacton, Rondout, and Schoharie) were performed to provide updated capacity tables and bathymetric maps. Depths were surveyed with a single-beam echo sounder and real-time kinematic global positioning system (RTK-GPS) along planned transects at predetermined intervals for each reservoir. A separate set of echo sounder data was collected along transects at oblique angles to the main transects for accuracy assessment. Field survey data was combined with water-surface elevations in a geographic information system to create three-dimensional surfaces representing reservoir-bed elevations in the...
Categories: Data;
Types: Citation,
Downloadable,
GeoTIFF,
Map Service,
Raster;
Tags: Cannonsville Reservoir,
Delaware County,
GPS measurement,
bathymetry,
single-beam echo sounder
From 2013 to 2015, bathymetric surveys of New York City’s six West of Hudson reservoirs (Ashokan, Cannonsville, Neversink, Pepacton, Rondout, and Schoharie) were performed to provide updated capacity tables and bathymetric maps. Depths were surveyed with a single-beam echo sounder and real-time kinematic global positioning system (RTK-GPS) along planned transects at predetermined intervals for each reservoir. A separate set of echo sounder data was collected along transects at oblique angles to the main transects for accuracy assessment. Field survey data was combined with water-surface elevations in a geographic information system to create three-dimensional surfaces representing reservoir-bed elevations in the...
Categories: Data;
Types: Citation,
Downloadable,
Map Service,
OGC WFS Layer,
OGC WMS Layer,
Shapefile;
Tags: Cannonsville Reservoir,
Delaware County,
GPS measurement,
bathymetry,
single-beam echo sounder
These datasets were created in support of the U.S. Geological Survey's (USGS) Next Generation Water Observing System (NGWOS) for the Delaware River Basin pilot study (Eberts, Wagner, and Woodside, 2019). The NGWOS utilizes real-time data, improved computational capabilities, and new technologies such as unmanned aerial vehicles (UAV) and autonomous underwater vehicles (AUV) to provide information on water quality and/or quantity, in more locations, quickly and efficiently (Eberts, Wagner, and Woodside, 2019). Combined with advanced modeling applications, the NGWOS will be an important tool for water-resource managers and emergency management. In this study, water-quality and bathymetric data were measured with an...
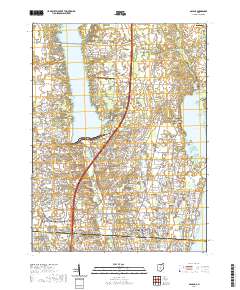
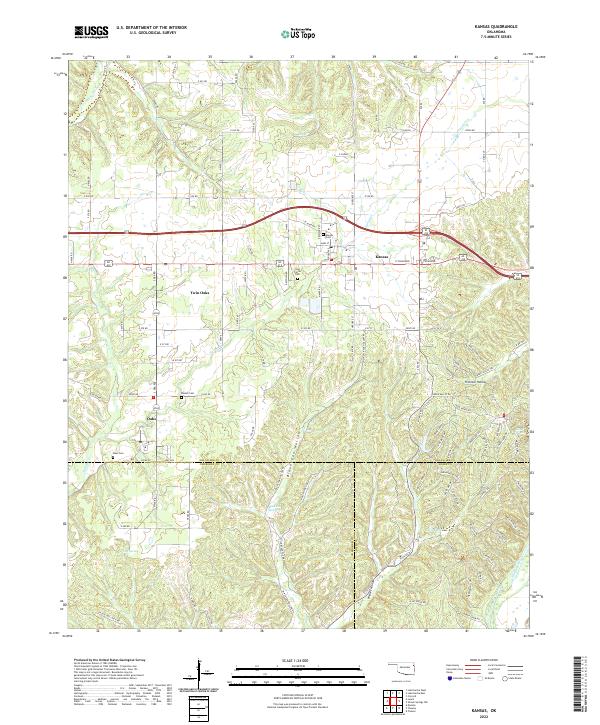
Layers of geospatial data include contours, boundaries, land cover, hydrography, roads, transportation, geographic names, structures, and other selected map features.
Layers of geospatial data include contours, boundaries, land cover, hydrography, roads, transportation, geographic names, structures, and other selected map features.
Layers of geospatial data include contours, boundaries, land cover, hydrography, roads, transportation, geographic names, structures, and other selected map features.
From 2013 to 2015, bathymetric surveys of New York City’s six West of Hudson reservoirs (Ashokan, Cannonsville, Neversink, Pepacton, Rondout, and Schoharie) were performed to provide updated capacity tables and bathymetric maps. Depths were surveyed with a single-beam echo sounder and real-time kinematic global positioning system (RTK-GPS) along planned transects at predetermined intervals for each reservoir. A separate set of echo sounder data was collected along transects at oblique angles to the main transects for accuracy assessment. Field survey data was combined with water-surface elevations in a geographic information system to create three-dimensional surfaces representing reservoir-bed elevations in the...
Categories: Data;
Types: Citation;
Tags: Delaware County,
GPS measurement,
Greene County,
Schoharie County,
Schoharie Reservoir,
|

|
