Filters: Tags: Hamilton County (X)
952 results (97ms)|
Filters
|
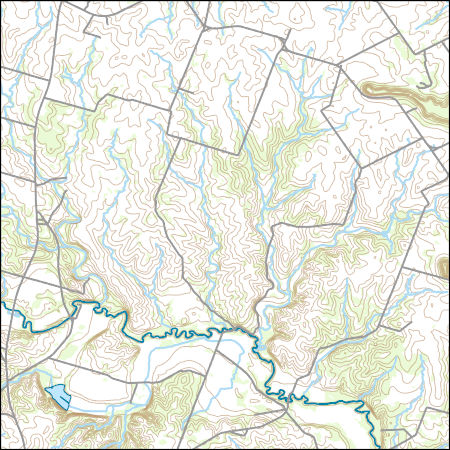
Layers of geospatial data include contours, boundaries, land cover, hydrography, roads, transportation, geographic names, structures, and other selected map features.
stream South road, W. Punky Pond. Single Shanty Research Station. Hamilton county, NY
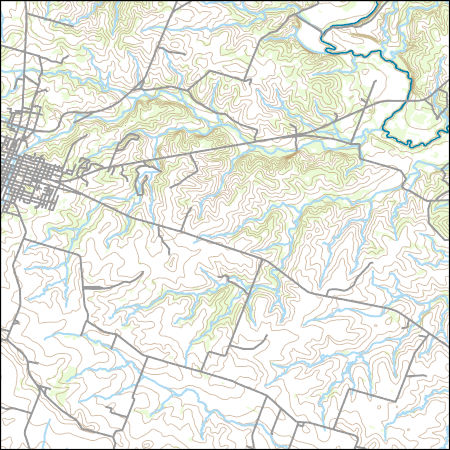
Layers of geospatial data include contours, boundaries, land cover, hydrography, roads, transportation, geographic names, structures, and other selected map features.
Layers of geospatial data include contours, boundaries, land cover, hydrography, roads, transportation, geographic names, structures, and other selected map features.
Layers of geospatial data include contours, boundaries, land cover, hydrography, roads, transportation, geographic names, structures, and other selected map features.
Types: Citation;
Tags: 7.5 x 7.5 minute,
7.5 x 7.5 minute,
Combined Vector,
Combined Vector,
Combined Vector,
Layers of geospatial data include contours, boundaries, land cover, hydrography, roads, transportation, geographic names, structures, and other selected map features.
Types: Citation;
Tags: 7.5 x 7.5 minute,
7.5 x 7.5 minute,
Combined Vector,
Combined Vector,
Combined Vector,
Layers of geospatial data include contours, boundaries, land cover, hydrography, roads, transportation, geographic names, structures, and other selected map features.
Types: Citation;
Tags: 7.5 x 7.5 minute,
7.5 x 7.5 minute,
Combined Vector,
Combined Vector,
Combined Vector,
These data are high-resolution bathymetry (lake bottom elevation) in a gridded XYZ format, generated from hydrographic surveys of Morse and Geist Reservoirs in April and May of 2016. Hydrographic data were collected using a multibeam echo-sounder (MBES) with integrated inertial navigation solution (INS) mounted on a marine survey vessel. Data were collected as the vessel traversed the lake along survey lines distributed throughout the area. Data collection software integrated and stored the depth data from the multibeam sonar and the horizontal and vertical position and attitude data of the vessel from the INS in real time. In the shallow areas, additional data were collected with an acoustic Doppler current profiler...
These data are high-resolution bathymetry (lake bottom elevation) in a gridded XYZ format, generated from hydrographic surveys of Morse Reservoir in May 2016. Hydrographic data were collected using a multibeam echo-sounder (MBES) with integrated inertial navigation solution (INS) mounted on a marine survey vessel. Data were collected as the vessel traversed the lake along survey lines distributed throughout the area. Data collection software integrated and stored the depth data from the multibeam sonar and the horizontal and vertical position and attitude data of the vessel from the INS in real time. In the shallow areas, additional data were collected with an acoustic Doppler current profiler (ADCP) and a real-time...
Categories: Data;
Tags: Hamilton County,
Indiana,
Morse Reservoir,
Noblesville,
United States of America,
The U.S. Geological Survey, in cooperation with the Savannah Valley Utility District, evaluated the groundwater hydrology of the Valley and Ridge carbonate aquifer system of Cambrian-Ordovician age in the area of Savannah and Gunstocker Creeks in northeastern Hamilton, southern Meigs, and northwestern Bradley Counties, Tennessee, from 2007 through 2009. The evaluation included and built on: 1) the results of test drilling conducted in the area in 1974 to determine the potential for groundwater as a source of public supply for the utility, and 2) the results of an investigation conducted to define recharge areas for wells used by groundwater-source public-supply water systems throughout Hamilton County in the early...

Layers of geospatial data include contours, boundaries, land cover, hydrography, roads, transportation, geographic names, structures, and other selected map features.
Layers of geospatial data include contours, boundaries, land cover, hydrography, roads, transportation, geographic names, structures, and other selected map features.
Layers of geospatial data include contours, boundaries, land cover, hydrography, roads, transportation, geographic names, structures, and other selected map features.
Layers of geospatial data include contours, boundaries, land cover, hydrography, roads, transportation, geographic names, structures, and other selected map features.
Types: Citation;
Tags: 7.5 x 7.5 minute,
7.5 x 7.5 minute,
Combined Vector,
Combined Vector,
Combined Vector,
These vector contour lines are derived from the 3D Elevation Program using automated and semi-automated processes. They were created to support 1:24,000-scale CONUS and Hawaii, 1:25,000-scale Alaska, and 1:20,000-scale Puerto Rico / US Virgin Island topographic map products, but are also published in this GIS vector format. Contour intervals are assigned by 7.5-minute quadrangle, so this vector dataset is not visually seamless across quadrangle boundaries. The vector lines have elevation attributes (in feet above mean sea level on NAVD88), but this dataset does not carry line symbols or annotation.
Layers of geospatial data include contours, boundaries, land cover, hydrography, roads, transportation, geographic names, structures, and other selected map features.
Types: Citation;
Tags: 7.5 x 7.5 minute,
7.5 x 7.5 minute,
Combined Vector,
Combined Vector,
Combined Vector,
Layers of geospatial data include contours, boundaries, land cover, hydrography, roads, transportation, geographic names, structures, and other selected map features.
Types: Citation;
Tags: 7.5 x 7.5 minute,
7.5 x 7.5 minute,
Combined Vector,
Combined Vector,
Combined Vector,
Layers of geospatial data include contours, boundaries, land cover, hydrography, roads, transportation, geographic names, structures, and other selected map features.
Types: Citation;
Tags: 7.5 x 7.5 minute,
7_5_Min,
Combined Vector,
Combined Vector,
Combined Vector,
Layers of geospatial data include contours, boundaries, land cover, hydrography, roads, transportation, geographic names, structures, and other selected map features.
Types: Citation;
Tags: 7.5 x 7.5 minute,
7_5_Min,
Combined Vector,
Combined Vector,
Combined Vector,
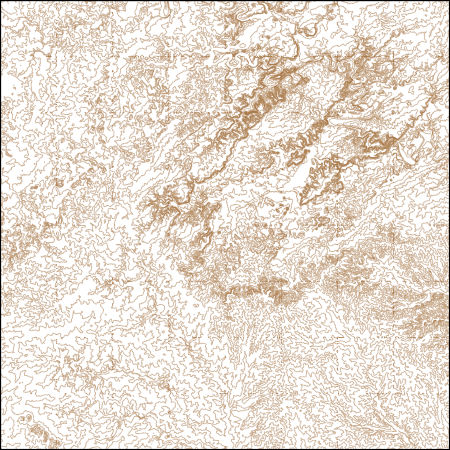
These vector contour lines are derived from the 3D Elevation Program using automated and semi-automated processes. They were created to support 1:24,000-scale CONUS and Hawaii, 1:25,000-scale Alaska, and 1:20,000-scale Puerto Rico / US Virgin Island topographic map products, but are also published in this GIS vector format. Contour intervals are assigned by 7.5-minute quadrangle, so this vector dataset is not visually seamless across quadrangle boundaries. The vector lines have elevation attributes (in feet above mean sea level on NAVD88), but this dataset does not carry line symbols or annotation.
|

|
