Filters: Tags: Hydrology (X) > partyWithName: U.S. Geological Survey (X)
767 results (148ms)|
Filters
Date Range
Extensions
Types Contacts
Categories
Tag Types
|
A total of 27 temperature sensors were deployed along the lower 90 miles of the Yakima River at 7 locations where cold water had been previously observed. These 7 cold-water areas had 3 to 6 temperature sensors installed to document the extent and duration of these cold-water areas and their impacts on mainstem temperatures of the Lower Yakima River. Cold-water areas included the mouths of tributaries, alongside channels, and within alcoves. Sensor deployments ranged from 1 to 2 years beginning in October 2018. All temperature data are included in the Yakima.temperatures.zip folder. Details of each monitoring location are provided in the site.locs.csv file. In addition to the raw data and site location information,...
Categories: Data;
Types: Map Service,
OGC WFS Layer,
OGC WMS Layer,
OGC WMS Service;
Tags: Aquatic Biology,
Benton County,
Ecology,
Hydrology,
Richland, WA,
Chalk Cliffs, located 8 miles southwest of Buena Vista, Colorado, is one of the most active debris-flow areas in the state (U.S. Geological Survey). This "Child item" page includes videos of floods captured by one of the high-definition cameras at the monitoring site in Chalk Cliffs, CO. This camera (Firehose Camera) is located near the bottom of the channel. The attached figure "station_and_camera_locations.png" provides an overview figure with the location of the four cameras and three stations along the channel. Video recording for all cameras is triggered using a rainfall threshold (Michel et al., 2019). The complete videos for all the cameras are downloaded manually during site visits. More detailed information...
Continuous water temperature data were collected at multiple sites along the Middle Fork and mainstem Willamette Rivers between Jasper and Newberg, Oregon, to support effectiveness monitoring for a large-scale channel and floodplain restoration program (Willamette Focused Investment Partnership, WFIP). Continuous water temperature loggers were deployed at a subset of WFIP restoration sites where river restoration activities were implemented to improve habitat conditions for native fish species. Data from water temperature monitoring will be used to evaluate the effectiveness of restoration activities at improving habitat conditions for Endangered Species Act (ESA)-listed salmonids and other native fish in the Willamette...
Categories: Data;
Tags: Albany,
Bowers Rock State Park,
Browns Island,
Collins Bay,
Middle Fork Willamette River,
The basis for these features is U.S. Geological Survey Scientific Investigations Report 2017-5024 Flood Inundation Mapping Data for Johnson Creek near Sycamore, Oregon. The domain of the HEC-RAS hydraulic model is a 12.9-mile reach of Johnson Creek from just upstream of SE 174th Avenue in Portland, Oregon, to its confluence with the Willamette River. Some of the hydraulics used in the model were taken from Federal Emergency Management Agency, 2010, Flood Insurance Study, City of Portland, Oregon, Multnomah, Clackamas, and Washington Counties, Volume 1 of 3, November 26, 2010. The Digital Elevation Model (DEM) utilized for the project was developed from lidar data flown in 2015 and provided by the Oregon Department...
Types: Citation;
Tags: Johnson Creek,
Portland, Oregon,
Willamette Valley,
digital elevation models,
floods,
The basis for these features is U.S. Geological Survey Scientific Investigations Report 2017-5024 Flood Inundation Mapping Data for Johnson Creek near Sycamore, Oregon. The domain of the HEC-RAS hydraulic model is a 12.9-mile reach of Johnson Creek from just upstream of SE 174th Avenue in Portland, Oregon, to its confluence with the Willamette River. Some of the hydraulics used in the model were taken from Federal Emergency Management Agency, 2010, Flood Insurance Study, City of Portland, Oregon, Multnomah, Clackamas, and Washington Counties, Volume 1 of 3, November 26, 2010. The Digital Elevation Model (DEM) utilized for the project was developed from lidar data flown in 2015 and provided by the Oregon Department...
Categories: Data;
Types: Citation,
Downloadable,
Map Service,
OGC WFS Layer,
OGC WMS Layer,
Shapefile;
Tags: Johnson Creek,
Portland, Oregon,
Willamette Valley,
digital elevation models,
floods,
This data release consist of the annual sediment depositional volume at five floodplain and five point bar sites on Powder River in southeastern Montana from 1979 through 2017. These 10 sites are a subgroup of a larger group of cross-sections established in 1975 and 1977 to monitor the channel changes along a 90-kilometer reach of Powder River. In addition to the sediment deposition data, characteristic of the annual peak flood are listed. The data are in 1 Excel files containing worksheets (10) corresponding to each channel cross-section .
Categories: Data;
Tags: Geomorphology,
High Plains,
Powder River,
Powder River Basin,
Powder River County,
This data release contains monthly 270-meter resolution Basin Characterization Model (BCMv8) climate and hydrologic variables for Localized Constructed Analog (LOCA; Pierce et al., 2014)-downscaled ACCESS 1.0 Global Climate Model (GCM) for Representative Concentration Pathway (RCP) 4.5 (medium-low emissions) and 8.5 (high emissions) for hydrologic California. The LOCA climate scenarios span water years 1950 to 2099 with greenhouse-gas forcings beginning in 2006. The LOCA downscaling method has been shown to produce better estimates of extreme events and reduces the common downscaling problem of too many low-precipitation days (Pierce et al., 2014). Ten GCMs were selected from the full ensemble of models from the...
This metadata record presents analytical results for laboratory microcosms conducted during 2016–18 as part of a study to develop a field test and numerical interpretation method to determine the effective diffusion coefficients and sorption coefficients of trichloroethene (TCE) and daughter products in the rock matrix of sedimentary rock, as well as biodegradation rate coefficients in the borehole. The biodegradation rate coefficients in the borehole are an important component of defining the back-diffusion of TCE from the matrix of sedimentary rock. Microcosm experiments were conducted with microbial community samples and groundwater collected from boreholes in the field test area to define anaerobic biodegradation...
Parameter values for the Precipitation Runoff Modeling System (PRMS) using the National Hydrologic Modeling (NHM) infrastructure. The contents of the attached zip folder are a direct download from the USGS bitbucket repository titled National Hydrologic Model Parameter Database (NhmParamDb) (https://my.usgs.gov/bitbucket/projects/MOWS/repos/nhmparamdb/browse). The NhmParamDb is stored using a Git version control system, which tracks modifications to the master dataset through 'commits'. Each commit has a unique code to allow for retroactive identification of any given component of the repository. The specific attributes of the download contained in this release are: Date: May 8, 2017 Commit: 6ccc41d5688 Filename:...
Digital flood-inundation maps for a 7.5-mile reach of the White River at Noblesville, Indiana, were created by the U.S. Geological Survey (USGS) in cooperation with the Indiana Department of Transportation. The flood-inundation maps, which can be accessed through the USGS Flood Inundation Mapping Science website at https://water.usgs.gov/osw/flood_inundation/, depict estimates of the areal extent and depth of flooding corresponding to selected water levels (stages) at the White River at Noblesville, Ind., streamgage (USGS station number 03349000). Real-time stages at this streamgage may be obtained from the USGS National Water Information System at https://waterdata.usgs.gov/nwis or the National Weather Service...
With increasing concerns about the impact of warming temperatures on water resources, more attention is being paid the relationship between runoff and precipitation, or runoff efficiency. Temperature is a key influence on Colorado River runoff efficiency, and warming temperatures are projected to reduce runoff efficiency. Here, we investigate the nature of runoff efficiency in the upper Colorado River (UCRB) basin over the past 400 years, with a specific focus on major droughts and pluvials, and to contextualize the instrumental period. We first verify the feasibility of reconstructing runoff efficiency from tree-ring data. The reconstruction is then used to evaluate variability in runoff efficiency over periods...
Categories: Data;
Tags: Climatology,
Climatology,
Colorado River,
Hydrology,
Lees Ferry (historical),
Paleohydrologic records provide a valuable perspective on the variability of streamflow and hydroclimate that is critical for water resource planning and placing present day and future conditions into a long-term context. Until now, key insights gained from streamflow reconstructions in the other river basins across the Western U.S. been lacking in the Upper Missouri River Basin due to a lack of extended streamflow records. Here we utilize a new database of naturalized streamflow records for the Upper Missouri and an expanded network of tree-ring records from the region to reconstruct streamflow at 31 gaging locations across the major Mountain Headwaters of the United States’ largest river basin. The database also...
Categories: Data;
Tags: Missouri Headwaters,
North Platte Headwaters,
South Platte Headwaters,
USGS Science Data Catalog (SDC),
Upper Missouri,
This dataset documents the depth to groundwater measured in wells screened in the Chicot aquifer, Evangeline aquifer, Jasper aquifer, Burkeville confining unit, Catahoula confining system, or a combination of multiple hydrogeologic units in the greater Houston area, Texas for 2021. The U.S. Geological Survey prepared this dataset in cooperation with the Harris‐Galveston Subsidence District, City of Houston, Fort Bend Subsidence District, Lone Star Groundwater Conservation District, and Brazoria County Groundwater Conservation District. This dataset was created to provide resource managers, public officials, researchers, and the general public with ready access to information regarding depths to groundwater in the...
These data were compiled to perform analyses of hydrologic change, changes in sediment transport, and channel change within Moenkopi Wash, Arizona. Objective(s) of our study were to quantify the magnitude and timing of changes in hydrology, sediment transport, and channel form within Moenkopi Wash and to determine the downstream effects of those changes on sediment delivery downstream to the Little Colorado River, and the Colorado River. These data represent instantaneous discharge records, suspended-sediment sample records, topographic survey data, historical aerial imagery, and channel polygons and centerlines mapped on the historical imagery. Instantaneous discharge records in this study began in 1926 and extend...
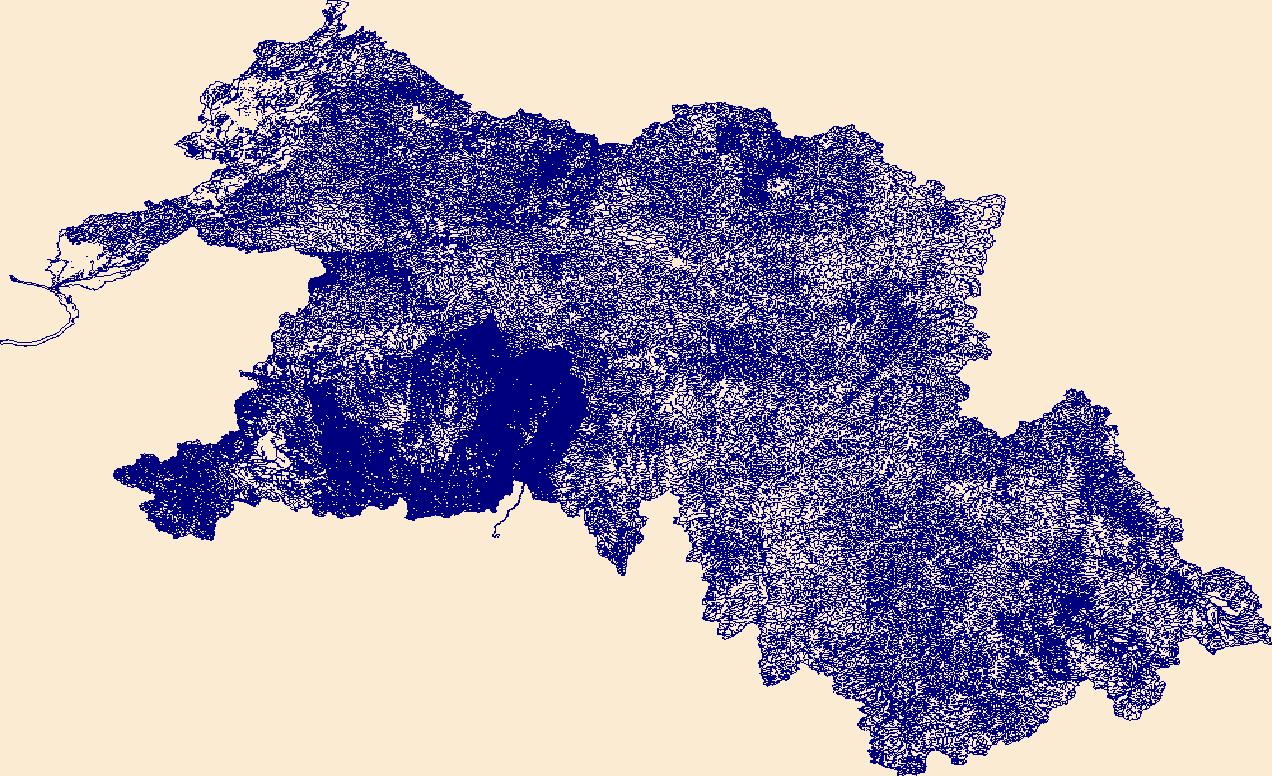
The High Resolution National Hydrography Dataset Plus (NHDPlus HR) is an integrated set of geospatial data layers, including the best available National Hydrography Dataset (NHD), the 10-meter 3D Elevation Program Digital Elevation Model (3DEP DEM), and the National Watershed Boundary Dataset (WBD). The NHDPlus HR combines the NHD, 3DEP DEMs, and WBD to create a stream network with linear referencing, feature naming, "value added attributes" (VAAs), elevation-derived catchments, and other features for hydrologic data analysis. The stream network with linear referencing is a system of data relationships applied to hydrographic systems so that one stream reach "flows" into another and "events" can be tied to and traced...
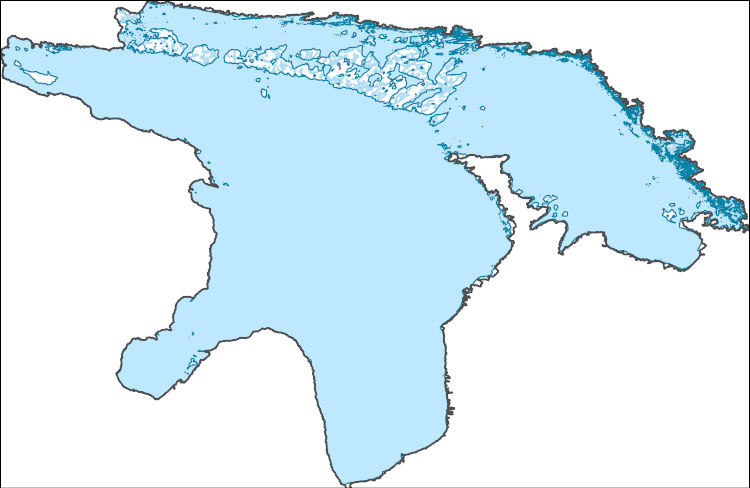
The High Resolution National Hydrography Dataset Plus (NHDPlus HR) is an integrated set of geospatial data layers, including the best available National Hydrography Dataset (NHD), the 10-meter 3D Elevation Program Digital Elevation Model (3DEP DEM), and the National Watershed Boundary Dataset (WBD). The NHDPlus HR combines the NHD, 3DEP DEMs, and WBD to create a stream network with linear referencing, feature naming, "value added attributes" (VAAs), elevation-derived catchments, and other features for hydrologic data analysis. The stream network with linear referencing is a system of data relationships applied to hydrographic systems so that one stream reach "flows" into another and "events" can be tied to and traced...
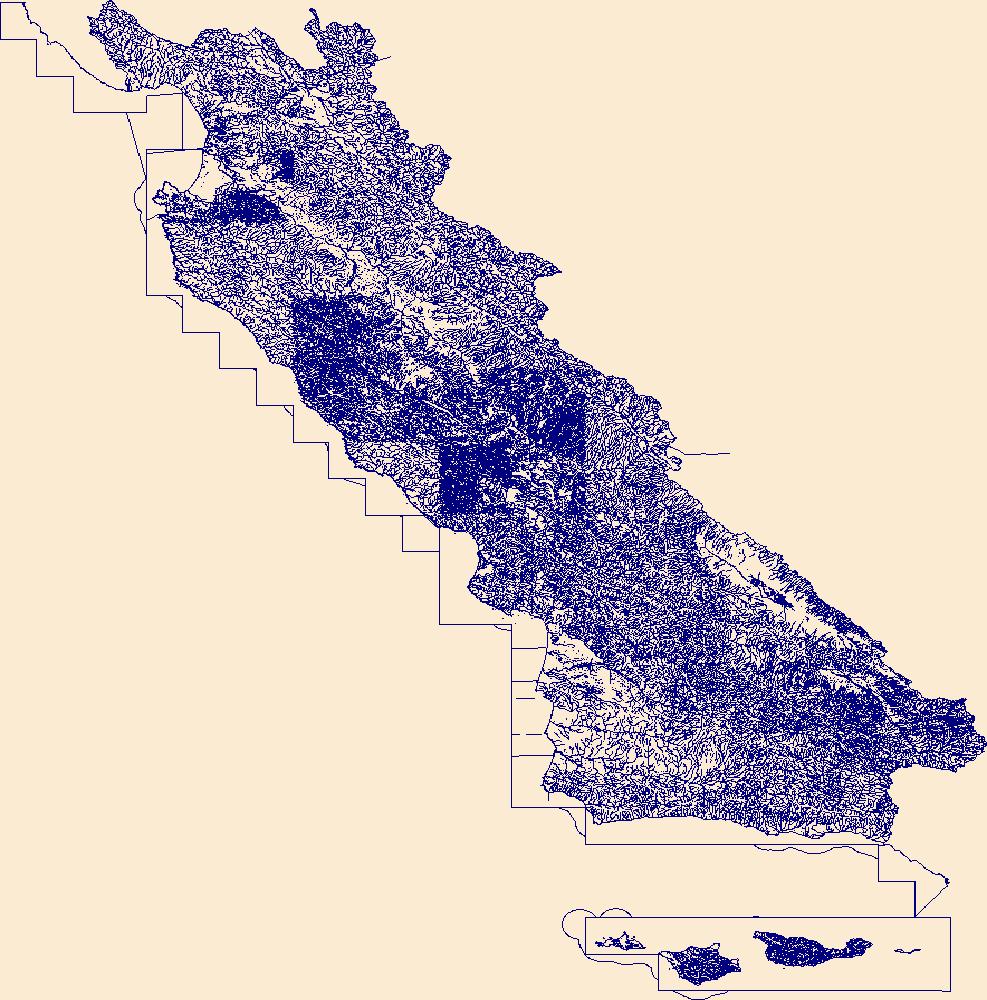
The High Resolution National Hydrography Dataset Plus (NHDPlus HR) is an integrated set of geospatial data layers, including the best available National Hydrography Dataset (NHD), the 10-meter 3D Elevation Program Digital Elevation Model (3DEP DEM), and the National Watershed Boundary Dataset (WBD). The NHDPlus HR combines the NHD, 3DEP DEMs, and WBD to create a stream network with linear referencing, feature naming, "value added attributes" (VAAs), elevation-derived catchments, and other features for hydrologic data analysis. The stream network with linear referencing is a system of data relationships applied to hydrographic systems so that one stream reach "flows" into another and "events" can be tied to and traced...
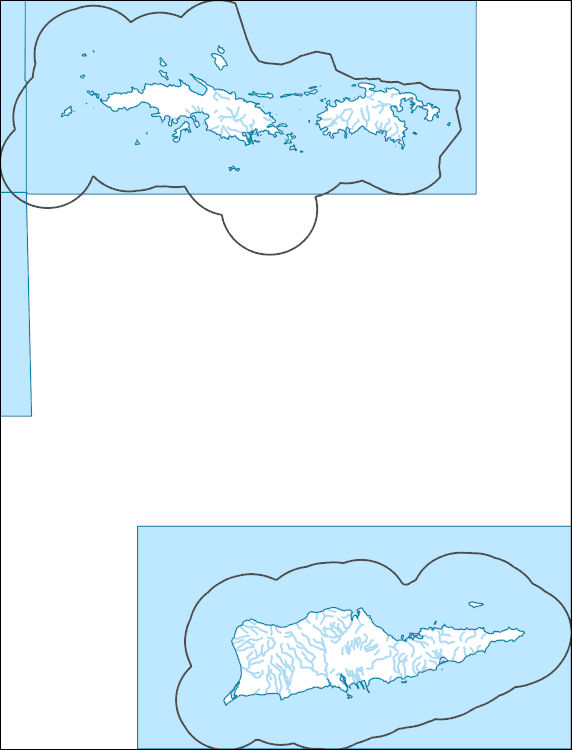
The High Resolution National Hydrography Dataset Plus (NHDPlus HR) is an integrated set of geospatial data layers, including the best available National Hydrography Dataset (NHD), the 10-meter 3D Elevation Program Digital Elevation Model (3DEP DEM), and the National Watershed Boundary Dataset (WBD). The NHDPlus HR combines the NHD, 3DEP DEMs, and WBD to create a stream network with linear referencing, feature naming, "value added attributes" (VAAs), elevation-derived catchments, and other features for hydrologic data analysis. The stream network with linear referencing is a system of data relationships applied to hydrographic systems so that one stream reach "flows" into another and "events" can be tied to and traced...
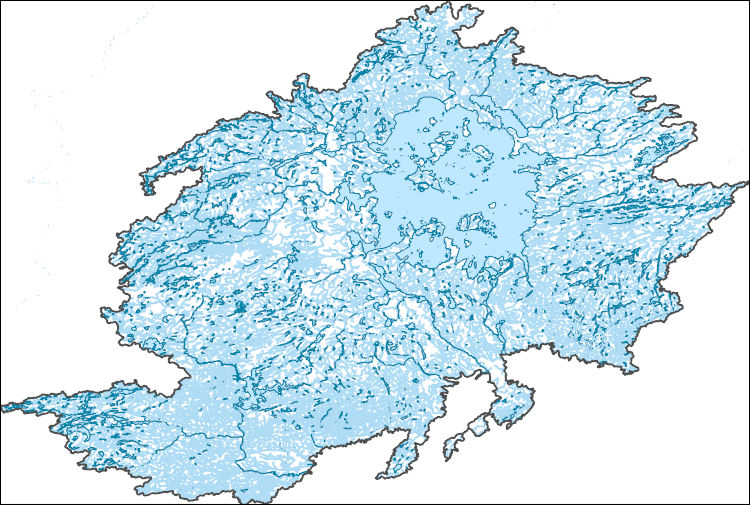
The High Resolution National Hydrography Dataset Plus (NHDPlus HR) is an integrated set of geospatial data layers, including the best available National Hydrography Dataset (NHD), the 10-meter 3D Elevation Program Digital Elevation Model (3DEP DEM), and the National Watershed Boundary Dataset (WBD). The NHDPlus HR combines the NHD, 3DEP DEMs, and WBD to create a stream network with linear referencing, feature naming, "value added attributes" (VAAs), elevation-derived catchments, and other features for hydrologic data analysis. The stream network with linear referencing is a system of data relationships applied to hydrographic systems so that one stream reach "flows" into another and "events" can be tied to and traced...
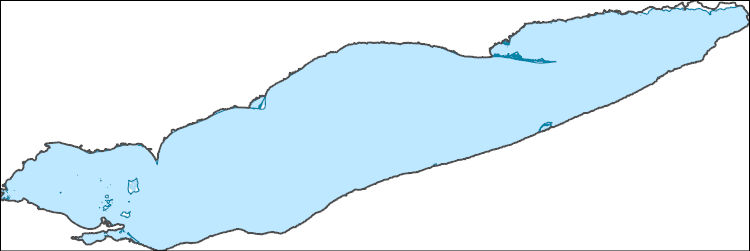
The High Resolution National Hydrography Dataset Plus (NHDPlus HR) is an integrated set of geospatial data layers, including the best available National Hydrography Dataset (NHD), the 10-meter 3D Elevation Program Digital Elevation Model (3DEP DEM), and the National Watershed Boundary Dataset (WBD). The NHDPlus HR combines the NHD, 3DEP DEMs, and WBD to create a stream network with linear referencing, feature naming, "value added attributes" (VAAs), elevation-derived catchments, and other features for hydrologic data analysis. The stream network with linear referencing is a system of data relationships applied to hydrographic systems so that one stream reach "flows" into another and "events" can be tied to and traced...
|